
Most people repeat a small set of foods without noticing. The free seven-day Variety Map shows that set on the app’s “Food variety this week” screen. It uses meals recorded over the last seven days. The example below comes from the monthly Nutrition Report: foods recorded during the month appear in color, while other foods in the same groups stay faded.
It is a quick way to find one useful addition to meals that already work, not a checklist to complete.
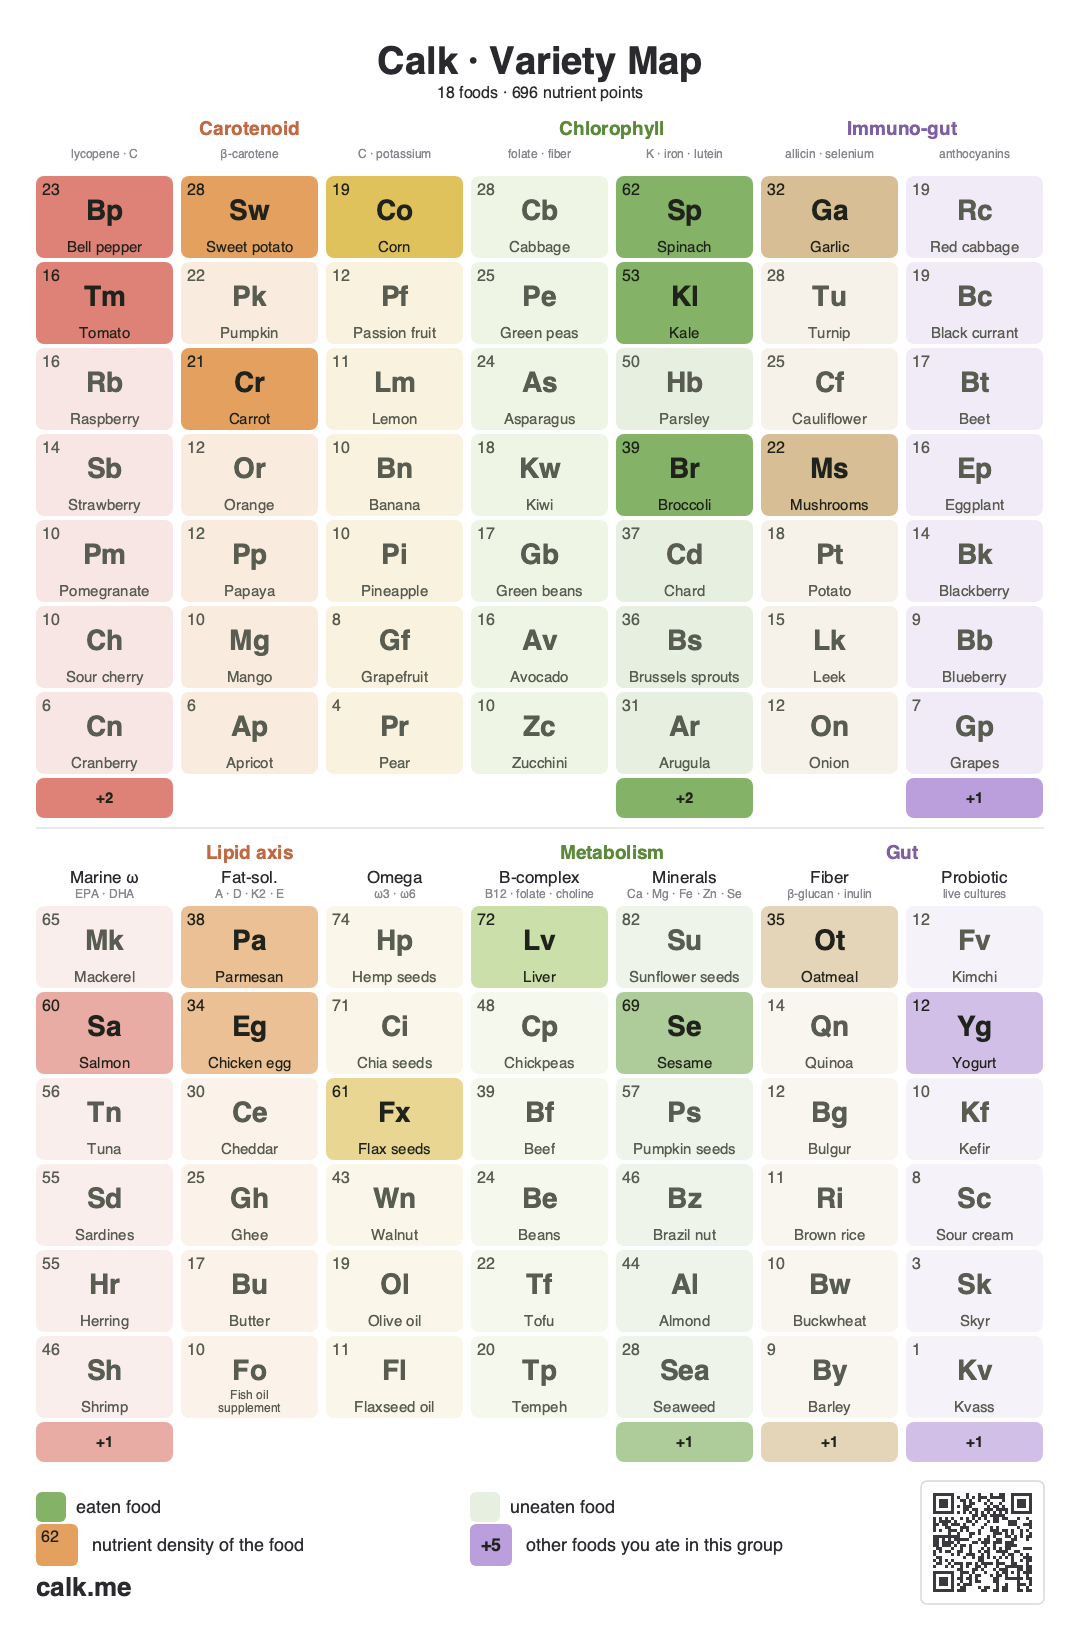
What the map can tell you#
Look for patterns, not an ideal score:
- Does one color or food group dominate the map?
- Are fish, legumes, whole grains, nuts, seeds or fermented foods almost absent?
- Which faded food would fit a meal you already repeat?
- Did this month become narrower than the previous one?
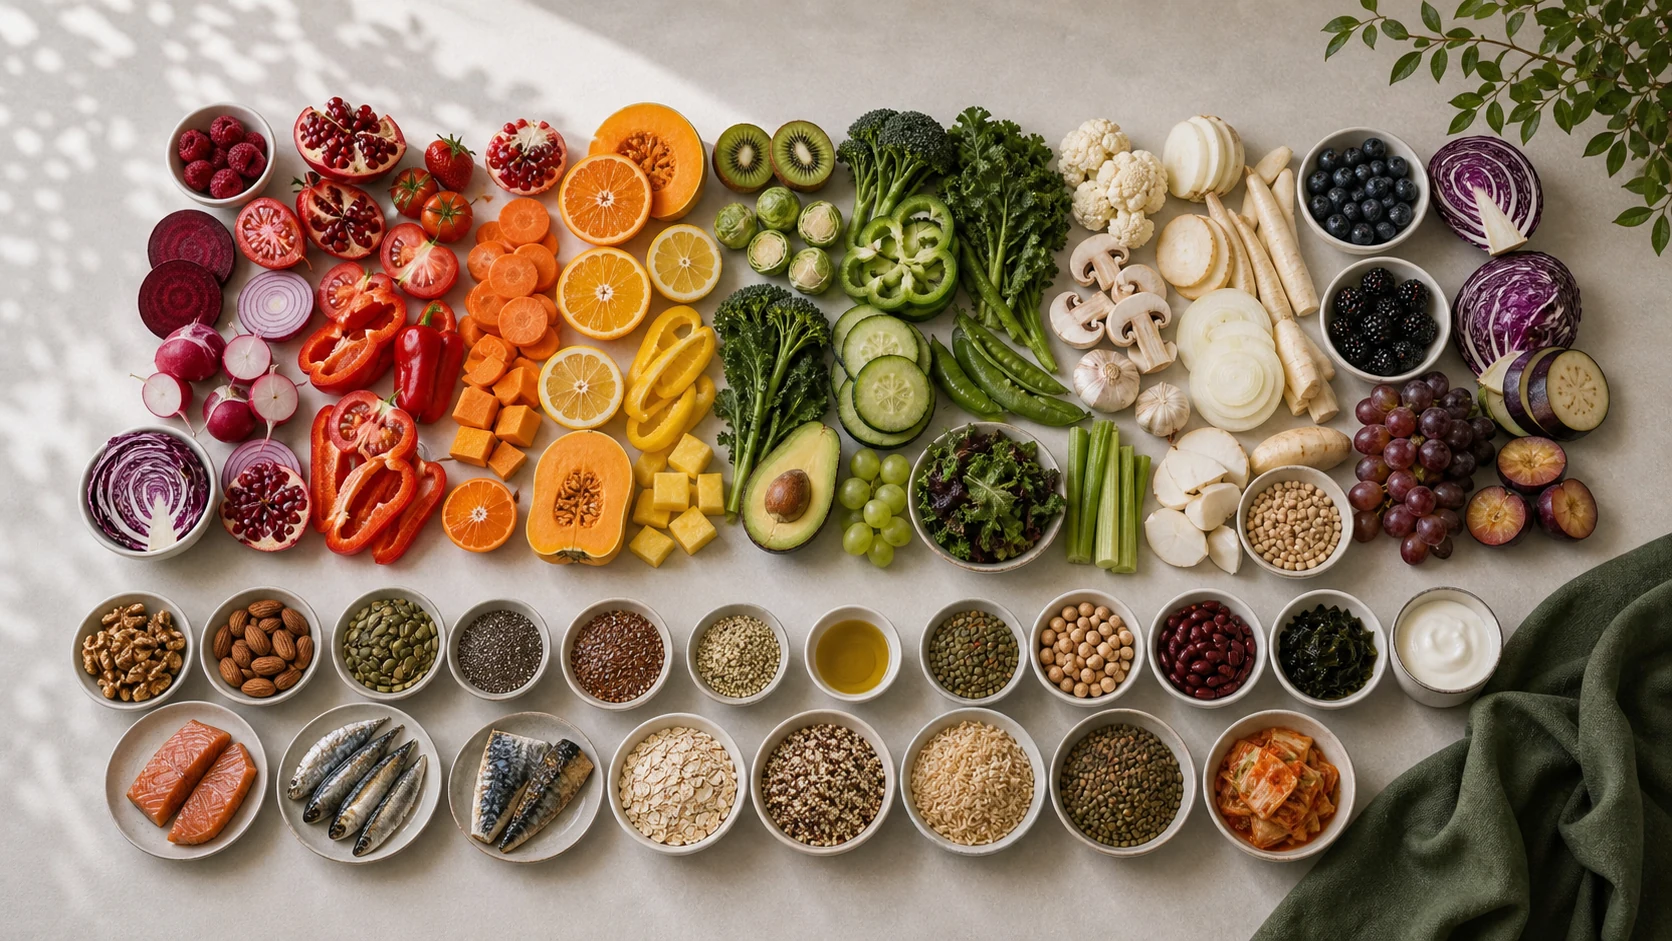
A wider range of foods can widen nutrient coverage too, because different foods carry different combinations of fiber, fats, vitamins and minerals. Variety on its own still does not make a diet balanced.
The popular “30 plants a week” idea came from an observational comparison in the American Gut Project. It is a useful prompt, not a required threshold. The exact finding and its limits are explained in where 30 plants a week comes from.
What the number in each square means#
The number is a nutrient-density score calculated for 100 g of the food. Calk combines its contribution across a broad set of nutrients, caps each nutrient so that one unusually high value cannot dominate the whole score, and adds a small plant-compound bonus to produce.
A higher number means a broader concentration of nutrients in the model. It does not mean the food is healthier for every person, and 100 g is the unit of the calculation, not a portion to aim for.
Spinach, for example, scores high because it contributes across several nutrient categories. Cucumber scores lower and still adds water, volume, texture and one more food to the rotation. The number compares one aspect of a food; it is not a grade.
For the formula and the separate nutrient-density matrix in the full report, read what the numbers in your Calk report mean.
Add variety to familiar meals#
Find a food on the map that you have not logged yet and could easily add to a familiar meal:
- rotate a second fruit into breakfast;
- add beans or lentils to a bowl or soup;
- change one vegetable in a repeated dinner;
- keep the same yogurt and rotate fruit, nuts or seeds;
- use frozen vegetables, canned beans or dried herbs when they are easier.
The best addition is one you will use again.
How you get your map#
Log food and open “Food variety this week”: the free map fills with your recent food entries, and you can share it.
The monthly map is part of the Calk Nutrition Report and is built from recorded meals. Your first month includes 30 days of full access at no charge; no bank card is required. The report is available during the free month or with an active subscription, once the last 30 days include at least 20 complete food-log days and weight data on at least 10 different days.
Calk is available on iPhone, iPad, and Android.