
Below are five pages from an example Nutrition Report, in the order they appear in the PDF: the overview, the maintenance calculation, calorie density and estimated satiety, vitamin and mineral gaps, and the conclusion. Food names are left in place, because every finding traces back to a recorded meal.
The month overview#
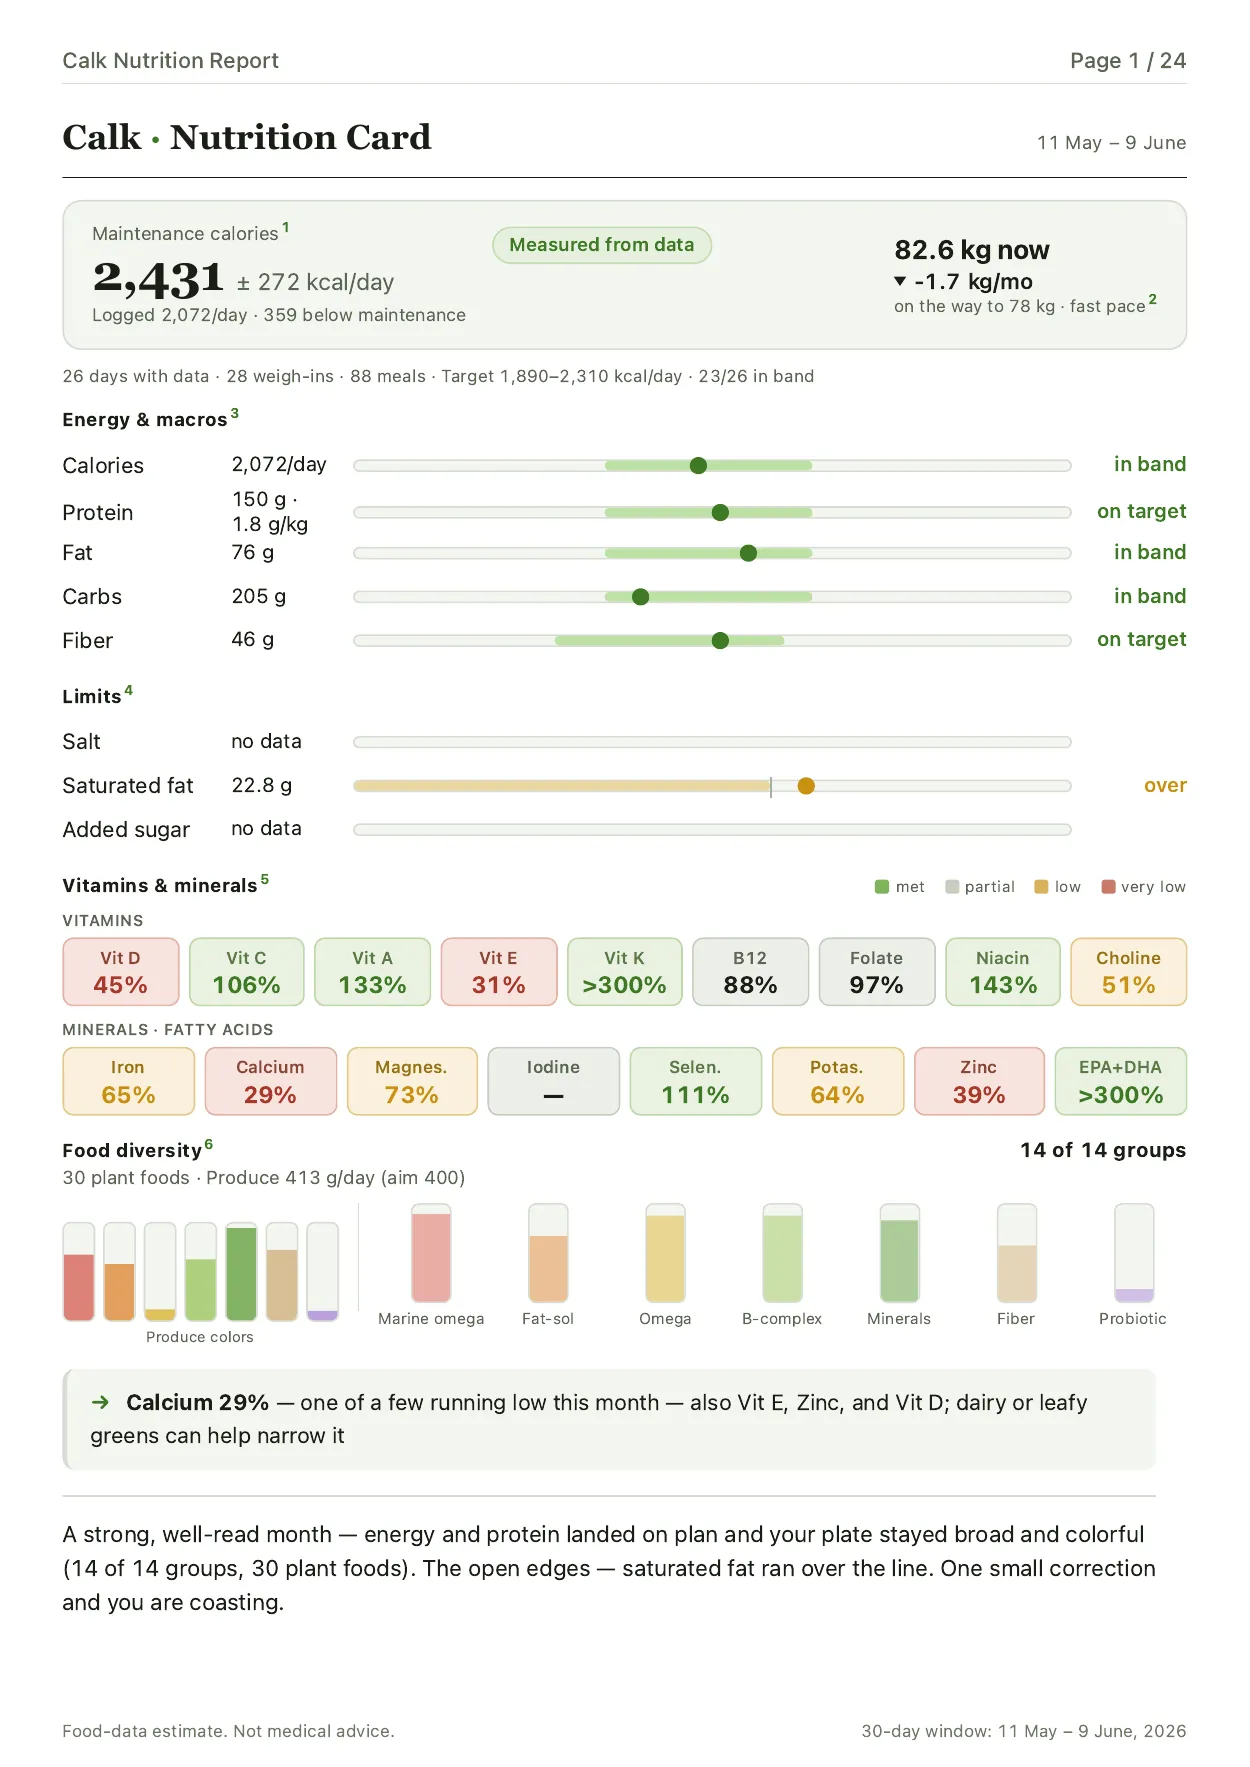
The first page brings the main indicators together and states the single most important finding of the month.
Maintenance calories#
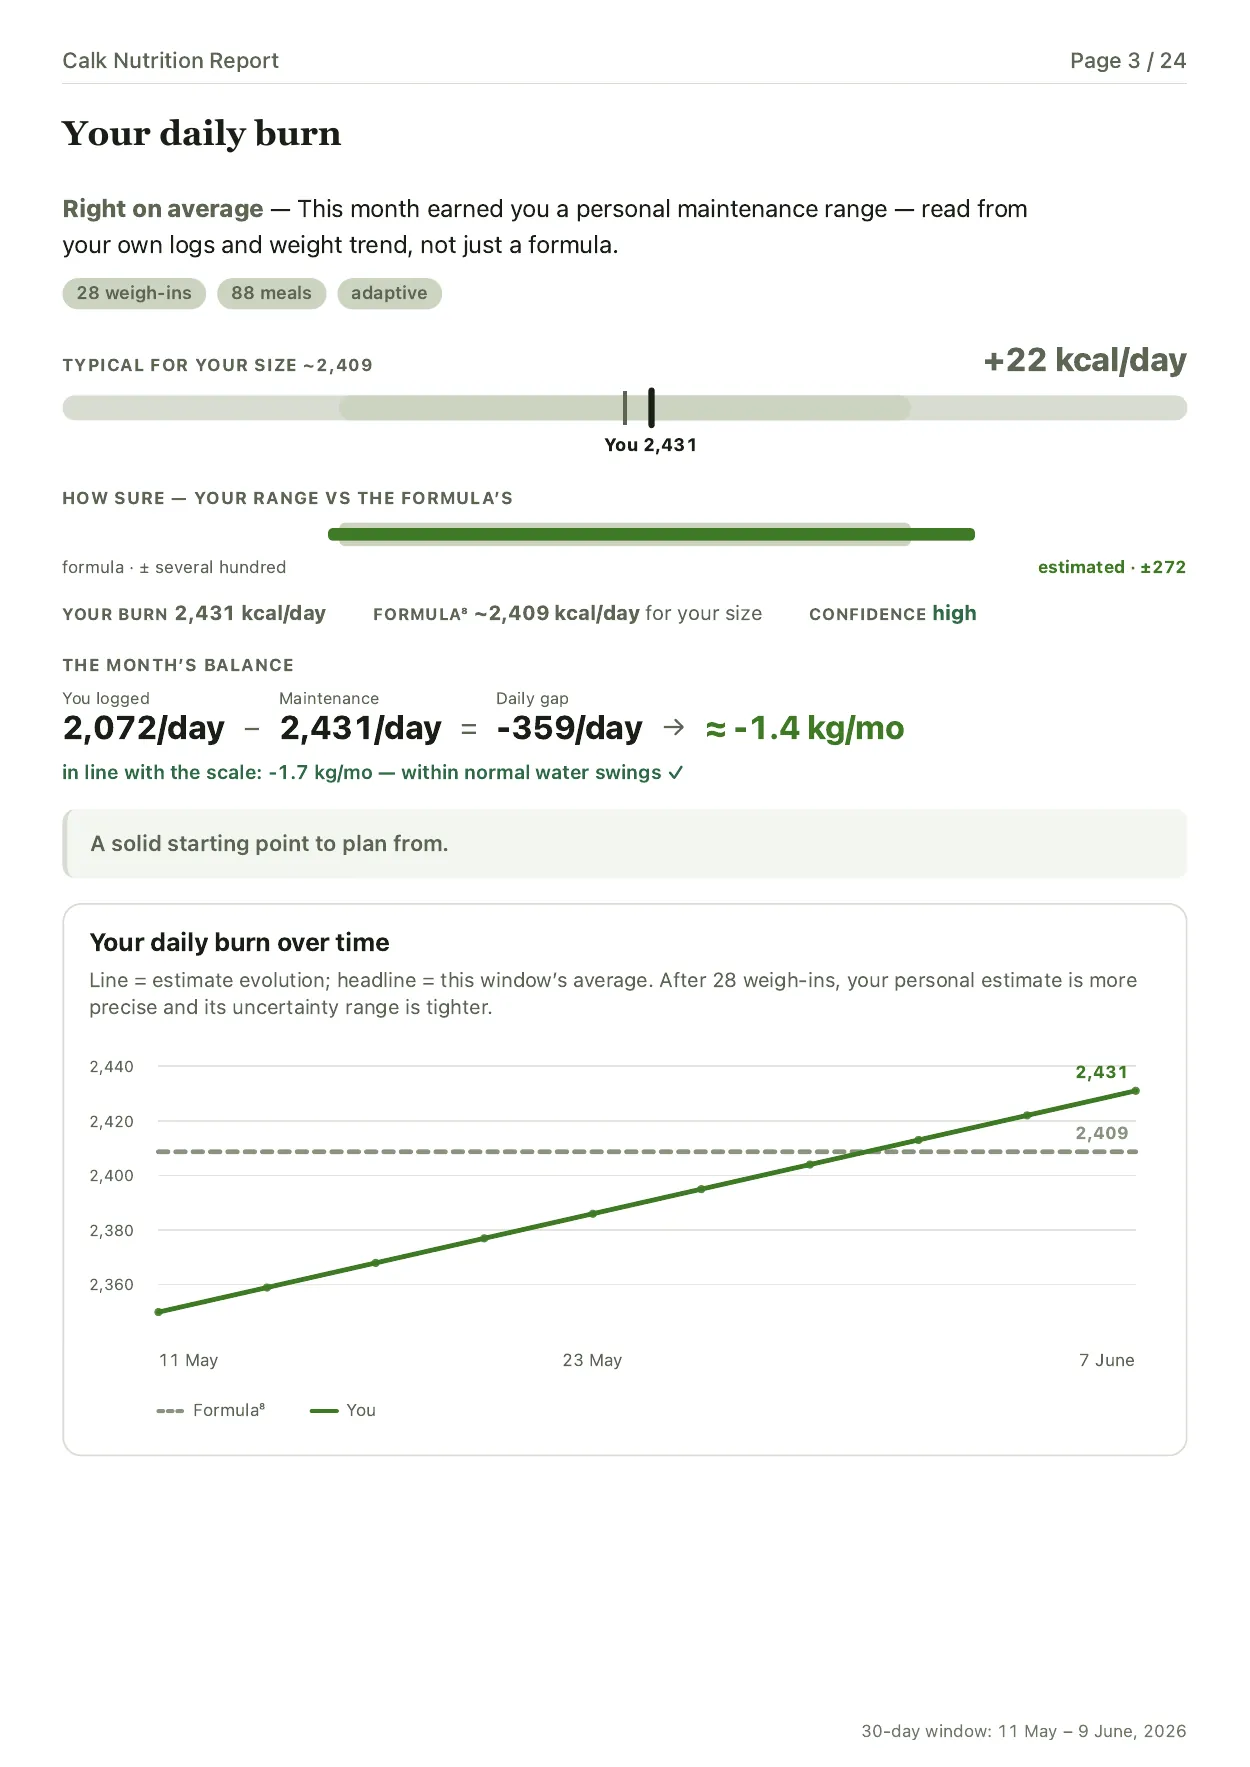
Calk compares recorded intake with the weight trend. When the data is sufficient, the estimate includes an uncertainty range. When it is not, the report uses a formula-based value and labels it clearly.
Calorie density and estimated satiety#
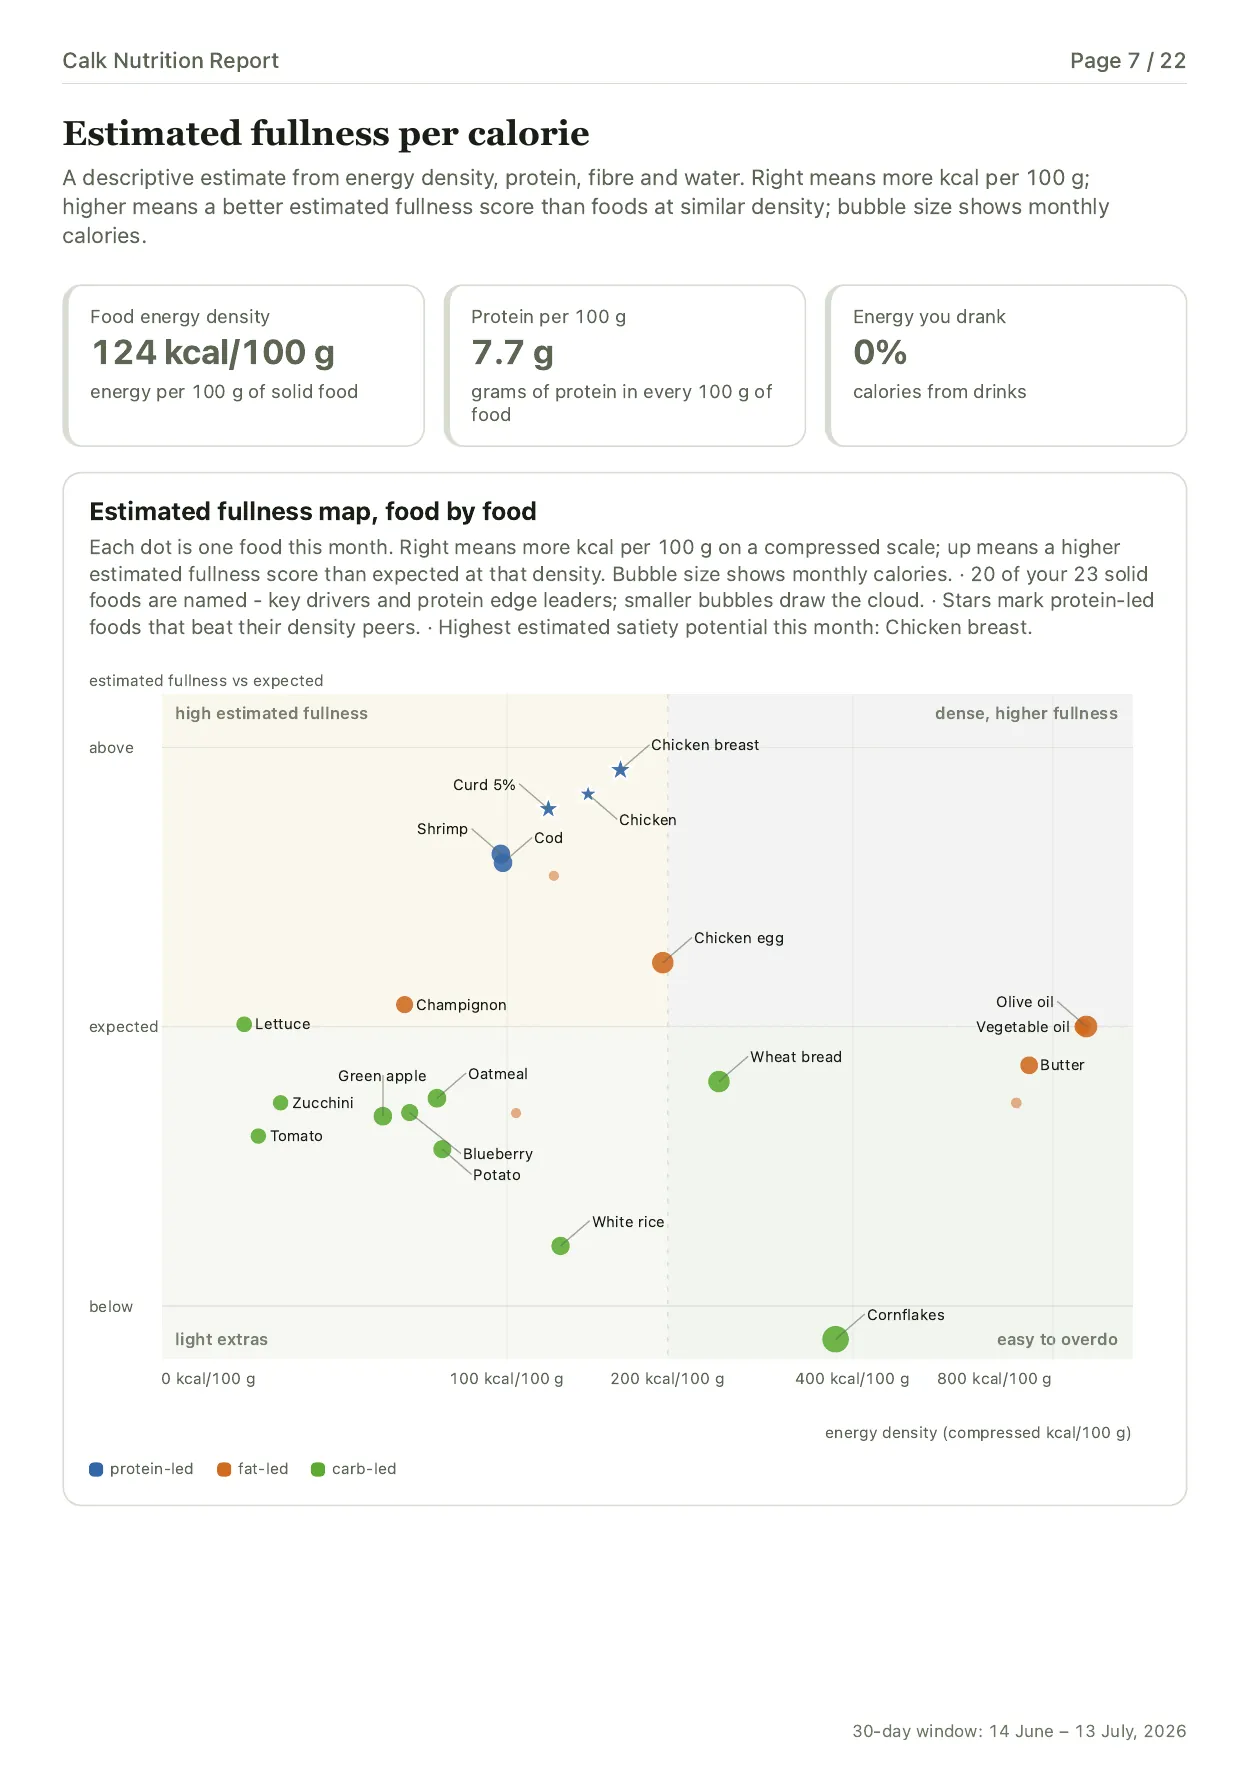
The report page puts each food of the month on two separate measures: calorie density, the kcal in 100 g, and estimated satiety, Calk’s satiety index with white bread at 100. Up and to the left is the better direction: fewer calories per 100 g and more estimated satiety. How Calk estimates satiety.
What’s low, and what fills the gap#
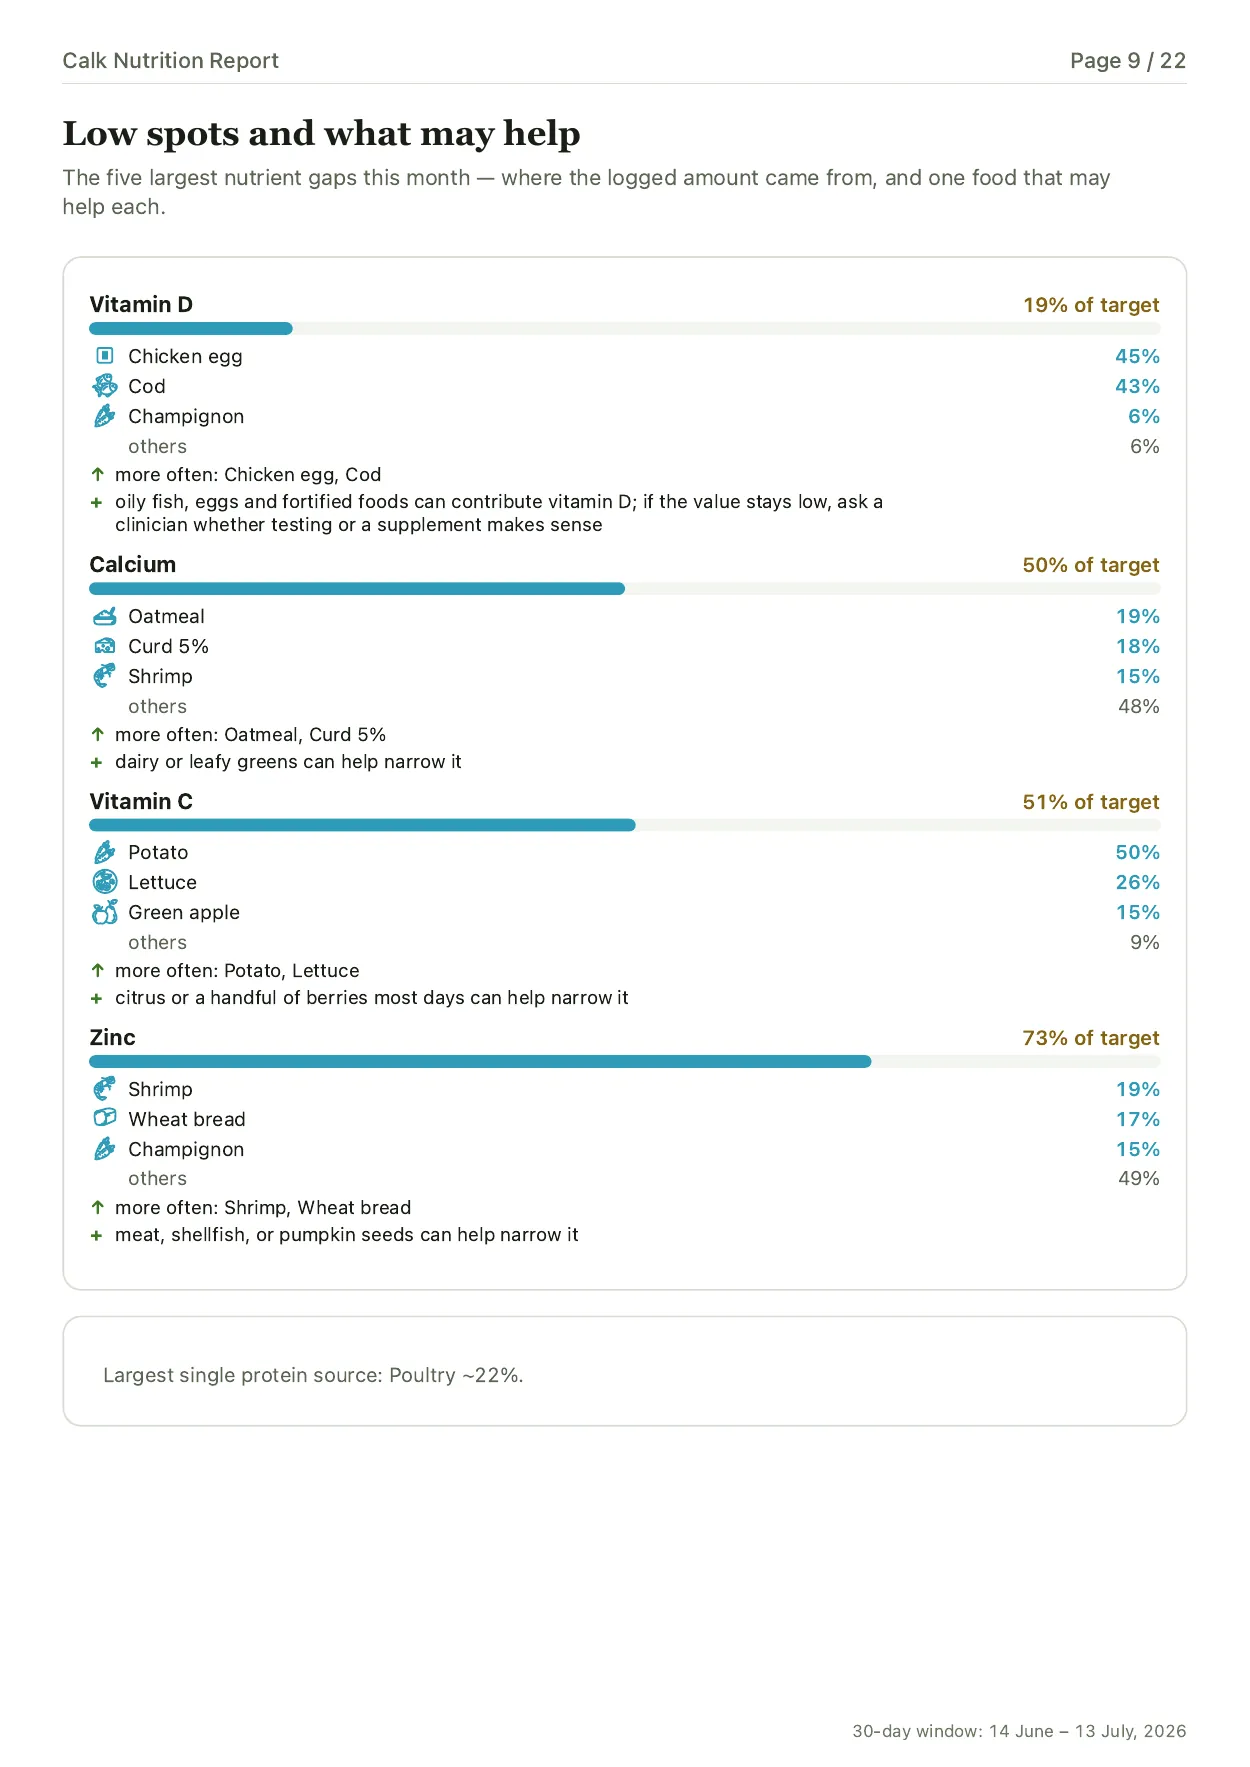
The report shows which vitamins and minerals fall below your target in your records and which foods supplied them. In this example, the main calcium sources are farmer cheese 5%, shrimp and lettuce; foods you could eat more often appear alongside.
The conclusion#
Near the end, the report lists what the records support, compares the month with the previous period and suggests one next step.
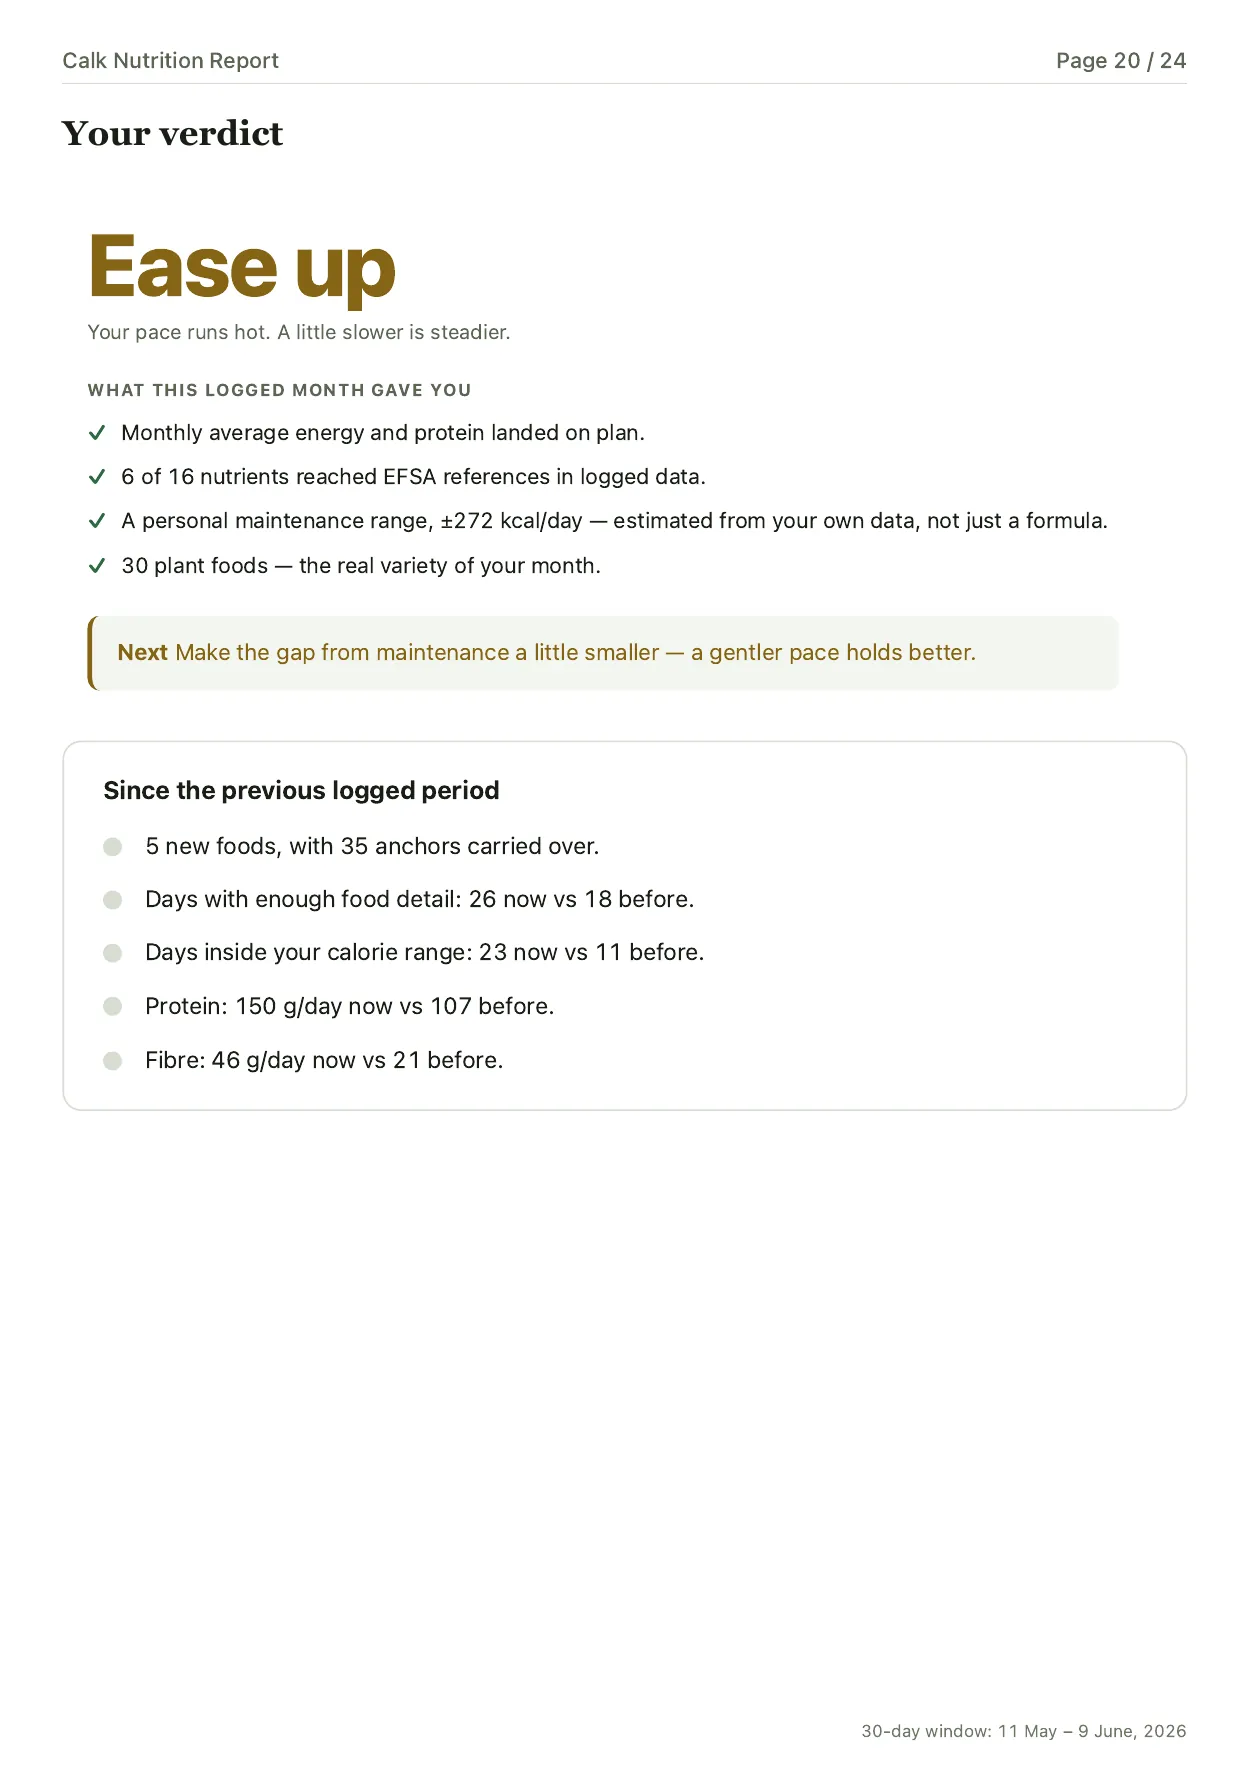
Most often that step lands on one repeating meal: make it more filling for the same calories, or bring in a food the month barely contains. The report covers other ground too — salt, nutrient gaps, variety. It suggests changes; it never bans a food. Choose a change and try it in a familiar meal. If you like it, save the new version with ♥. Keep logging while you put the changes into practice. Once they are all habits, the daily diary ends and your weight trend takes over. Return for a short food check if your eating or weight changes noticeably. Why this approach asks for less day-to-day control is covered separately.
How to read these figures#
Key figures carry notes: which days went into them and what the data cannot settle. Maintenance calories come with their uncertainty range, and nutrient percentages stay references for the diary. Read more on the page about figures and limitations.
Your first report during the free month#
Your first 30 days include full access and your first Nutrition Report, free, with no bank card required. Later reports are part of the paid tier. For a closer look at this kind of reading, see how a dietitian reads a food diary, and what Calk can do.
Calk is available on iPhone, iPad, and Android.