
The report turns records into estimates and comparisons. Three things are worth keeping apart as you read it: what was calculated from your own data, what comes from a published reference, and what the report could not calculate at all.
The diary is checked first#
Calculations use the days where food was recorded in enough detail. One snack or one meal does not make a complete day. Partial days stay in your history, but they do not count as complete records.
The first report unlocks after at least 20 complete food-log days and weight data on at least 10 different days over the last 30 days. Precision still varies by section: where a single calculation runs short of input, the report labels it or leaves it out.
Maintenance calories remain an estimate#
When the records are sufficient, Calk compares recorded intake with the weight trend and shows estimated maintenance calories with an uncertainty range.
When personal data is limited, Calk uses a calculation based on the Mifflin-St Jeor equation and an activity factor. The report identifies which method was used. Neither result is a direct measurement of metabolism.
Nutrients are compared with references#
Vitamins and minerals are compared with EFSA dietary reference values for the relevant age and sex. The percentage describes how much of the reference appeared in an average complete day of recorded food.
That is a statement about the diary: it cannot confirm that your intake was adequate, and it cannot point to a deficiency.
The two food scores answer different questions#
The nutrient-density matrix compares foods you recorded. For each food, it adds its contribution per 100 g across protein, fiber, nine vitamins and minerals, then subtracts saturated fat, sugar and salt. Every component is capped so that one extreme value cannot dominate the result. This is Calk’s NRF11.3 adaptation of the published NRF9.3 approach Fulgoni 2009.
The Variety Map has a different job. Color shows whether a food appeared in the month. The small number in each square is a precomputed score across a broader set of nutrients, with an additional plant-compound bonus for produce. It orders the suggestions inside a food group; it is not a personalized health grade.
Both scores describe 100 g of a food. Neither one says how much of it to eat, and neither stands in for the whole picture of meals, portions and medical context.
How Calk estimates satiety#
Calk keeps two separate measures for each food. Calorie density is the kcal in 100 g. Estimated satiety is Calk’s satiety index, a number for ranking foods on the scale Holt and colleagues used when they measured 38 common foods, with white bread at 100 Holt 1995. The better direction is lower calorie density and higher estimated satiety.
Where Holt measured a food, Calk uses the measurement: boiled potatoes are 323, croissants 47. For every other food, Calk calculates an index from its composition, that is the calories in 100 g, protein’s share of the energy and the fibre, on a scale as wide as Holt’s. Where a related food was measured, part of its measured difference carries over: baked potato follows Holt’s boiled potato, other pastries follow the croissant.
To check it, each of the 35 Holt foods that have a match in Calk’s catalog was estimated as if Holt had never measured it: the formula, the scale and the carried-over differences were all worked out again without that food. Of the 341 pairs where Calk calls one food clearly more filling than another, about one and a half times or more, Holt’s measurements agree in 88%. Across all the foods, the Spearman correlation between Calk’s estimates and Holt’s measurements is 0.71, and the Pearson correlation is 0.65. Holt’s measurements and Calk’s estimates share one chart in what fills you up more for the same calories.
Glycemic load: food, portion, composition#
The starting point is glycemic index × available carbohydrate in the portion / 100. The catalogue includes measured indices and estimates from similar foods or models.
Calk also accounts for protein and fat from other foods eaten around the same time, drawing on studies of mixed meals Sun 2014 Meng 2017. Results vary between studies, so we keep the adjustment small: a reduction of no more than 15%. The diary and report use one calculation.
What the report cannot know#
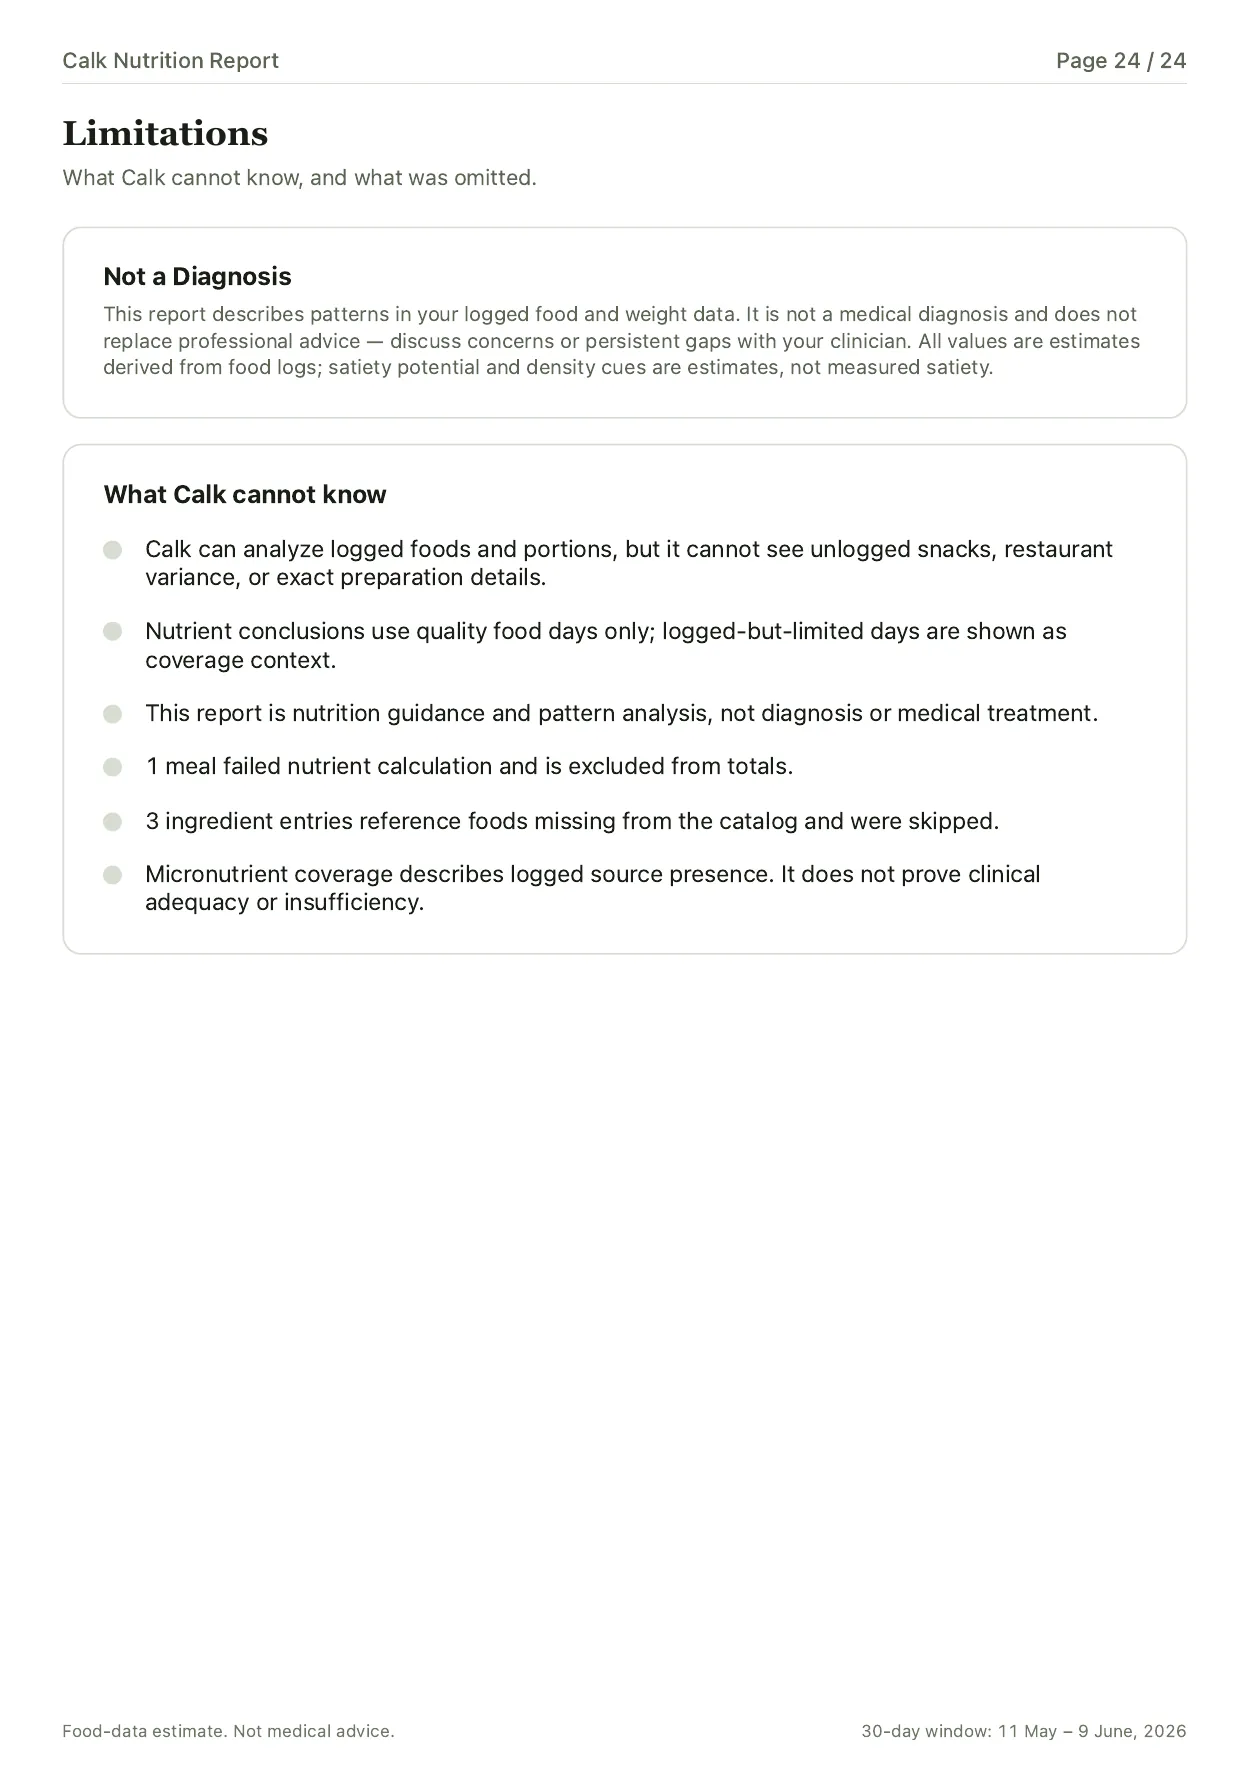
- Calk cannot see food that was not recorded.
- Restaurant portions and preparation details may differ from the entry.
- A photograph cannot determine the exact amount of oil, sauce or sugar.
- A food diary cannot replace laboratory tests, a diagnosis or professional care.
Every report ends with notes explaining its main figures and a list of calculations that had to be omitted. See pages from an example report.
Calk is available on iPhone, iPad, and Android.