
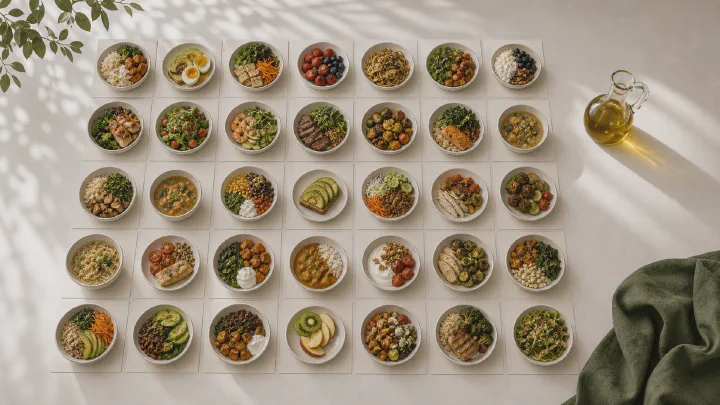
One dinner is easy to remember. It is harder to spot which breakfasts, sauces and snacks shape your diet week after week.
A 30-day food audit can show what you repeat, which choices change the total, where the diary is nutritionally strong and what one change is worth testing. It brings the recurring patterns together into a few specific findings.
Why a month is useful#
Calk’s monthly Nutrition Report brings the last 30 days together. That covers weekdays, weekends, meals out and familiar foods while unusual days are still easy to remember. See the Nutrition Report page for when your report is ready.
The key is repetition. A 2026 exploratory analysis included more than 20,000 adults who logged foods and drinks for two weeks. For the median user, nine frequent items accounted for 50% of entries, and 35 for 90% Tran 2026. A relatively small set of recurring foods explains much of the diary.
That is exactly what a food audit needs to find.
1. The meals and ingredients that repeat#
The report groups the foods you logged often enough to matter. It can show:
- your recurring breakfasts, lunches and dinners;
- the ingredients that appear across several meals;
- the cooking methods and sauces you choose repeatedly;
- the days and situations where the usual pattern changes.
This separates a routine from an exception. One restaurant dinner may be memorable, but a small addition that appears five days a week can contribute more to the month.
2. What supplies the calories#
The calorie total alone does not explain where it came from. Calk ranks the meals and ingredients that contributed to the month and compares ordinary days with days outside the usual range.
The useful result is concrete: not “eat better,” but “this repeated lunch, sauce, drink or portion changed the total most.” You can open the records behind the finding and see whether the result matches the diary.
The report also looks for a swing ingredient: something whose amount changes enough between repeats to move the day. Oil, rice, cheese or a spread can be a swing ingredient, but the report uses your records rather than assuming which one it will be.
3. Protein, fiber and nutrient coverage#
Calk calculates protein, fat, carbohydrates and fiber from the ingredients and preparation selected in each meal template. It also checks vitamins, minerals and other nutrients that are supported by the underlying food data.
The report shows how much of these nutrients you get from food, which foods supply them and how the amounts compare with daily reference targets.
That makes it easier to choose foods that complement your usual diet.
4. Nutrient density, satiety and variety#
Calories are only one view of food. The Nutrition Report also includes:
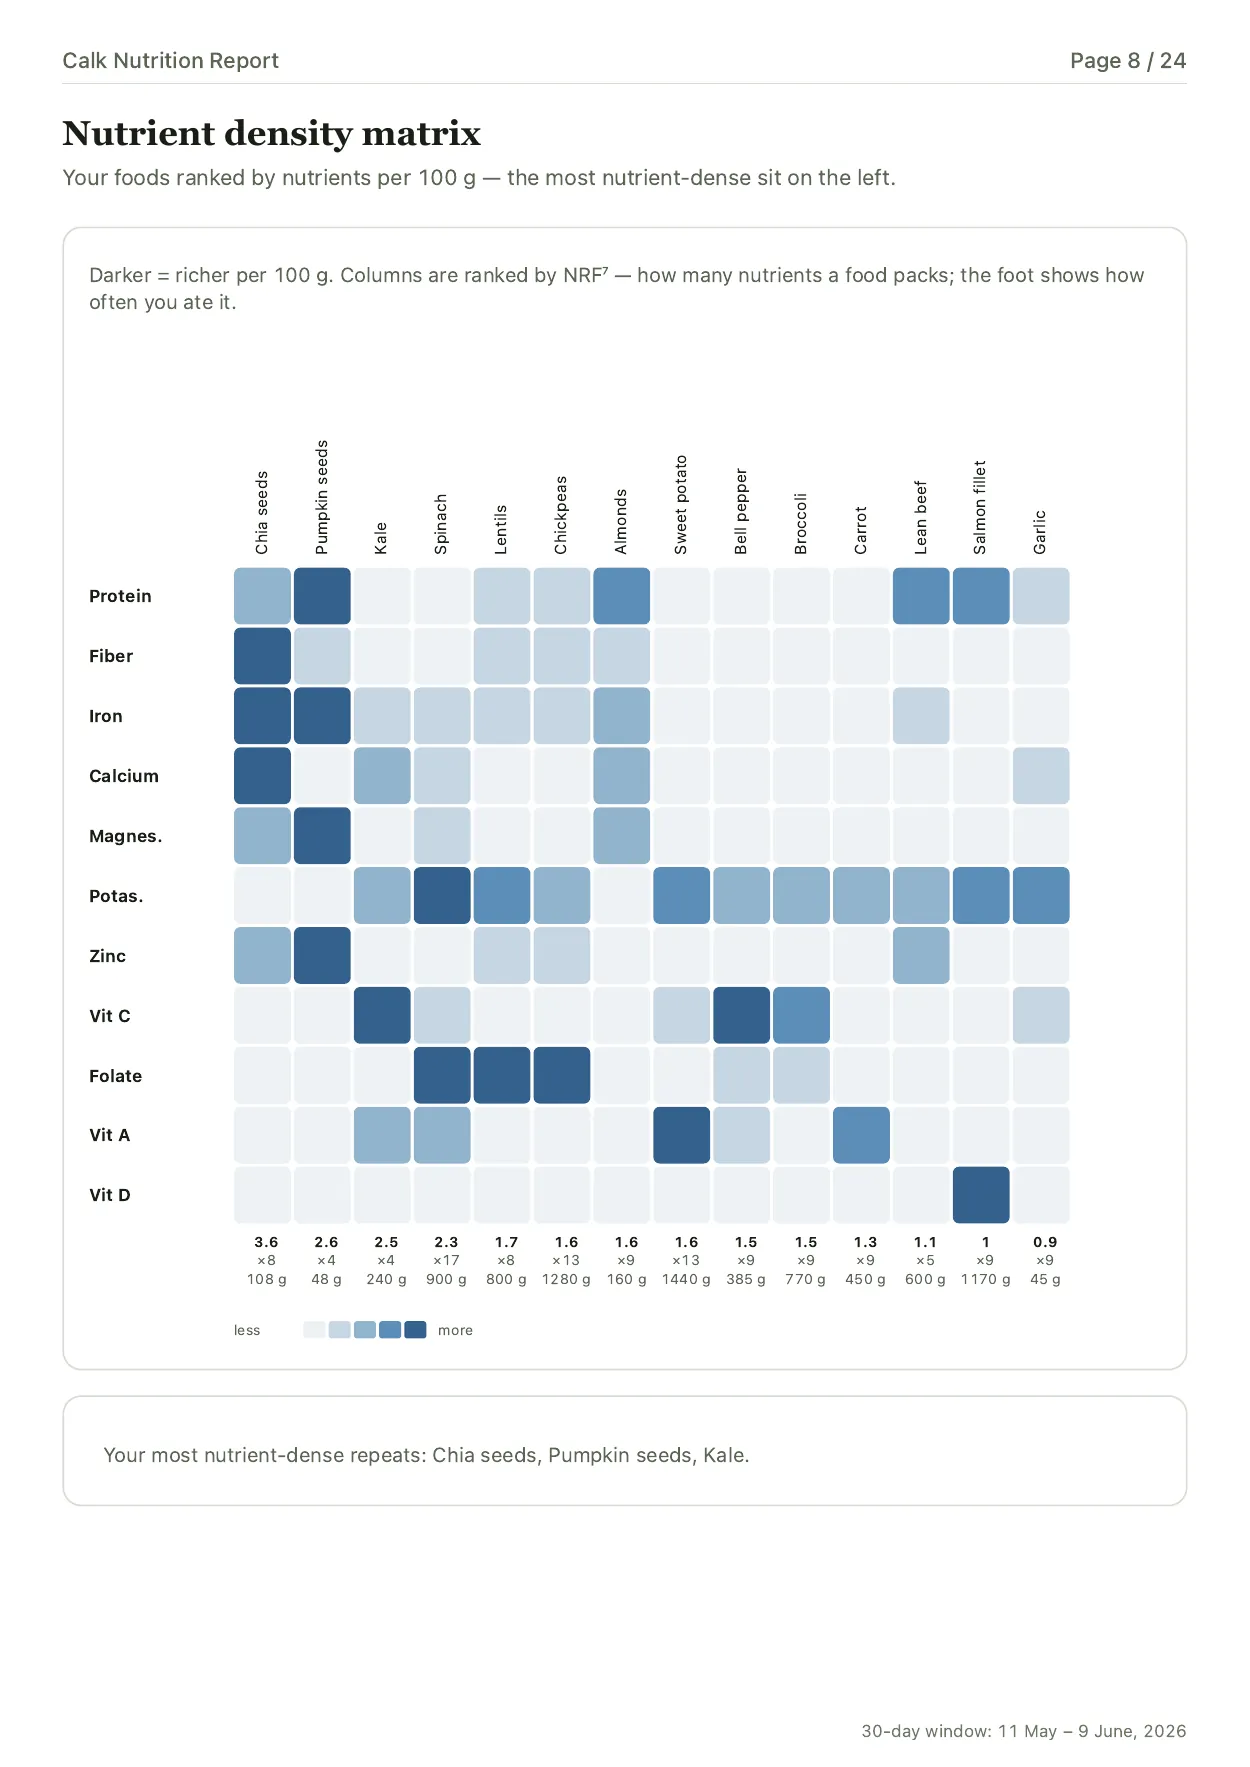
- a nutrient-density matrix comparing foods across vitamins, minerals, protein, fiber and other nutrients;
- an estimated-satiety view for comparing familiar meals;
- a Variety Map showing food groups and distinct plants in the diary.
Estimated satiety helps you compare options at the same calories: it follows the satiety index Holt and colleagues measured, with white bread at 100, and sits beside calorie density as a separate measure.
5. The weight trend and one next step#
When the report has enough weight data, it reads the smoothed trend alongside the food pattern. Weight answers whether the overall direction changed; the diary helps explain what changed in the routine.
The final recommendation follows from the days you recorded. It may concern a recurring portion, a calorie source, protein distribution, variety or the rate of weight change. The report shows which entries led to the suggestion.
What happens after the audit#
The next step is to adjust familiar meals so your new eating habits are easier to keep.
- Fewer calories per gram. Over two-day periods, 24 women were served the same menus at different calorie densities and could eat as much as they wanted. Cutting the density of all dishes by a quarter reduced intake by 24% — 575 kcal a day — with no difference in hunger and fullness ratings between conditions Rolls 2006. In a year-long trial, participants who reduced fat and added more fruit and vegetables ate a greater volume of food and reported less hunger than the group that only reduced fat Ello-Martin 2007.
- More protein. A review of short-term weight-loss studies found that higher-protein diets helped people lose more fat and better preserve fat-free mass, with a modest satiety benefit Leidy 2015.
- More fiber. In a series of systematic reviews and meta-analyses, the largest risk reductions across several outcomes were associated with 25–29 grams of fiber a day Reynolds 2019. These findings mainly concern health outcomes, rather than weight.
In practice, there are three choices. Add vegetables to a familiar dish, beans to soup or protein to breakfast. Replace a sauce, cooking method or the balance of ingredients. Keep meals that already work. If you want to lower calories, replace part of a meal, such as some of the side dish with vegetables, instead of simply adding more food. Read more in why diets don’t work.
Make the changes and follow your weight. Once the changes you chose are habits and the trend is on track, you can stop logging food every day and keep weighing yourself.
If your weight persistently moves away from your goal or your routine changes, return to the diary for a while to work out what needs adjusting.
See pages from an example Nutrition Report and how Calk reads a month of food. The full focused-logging process is in calorie tracking without the daily grind.
Calk is available on iPhone, iPad, and Android.