
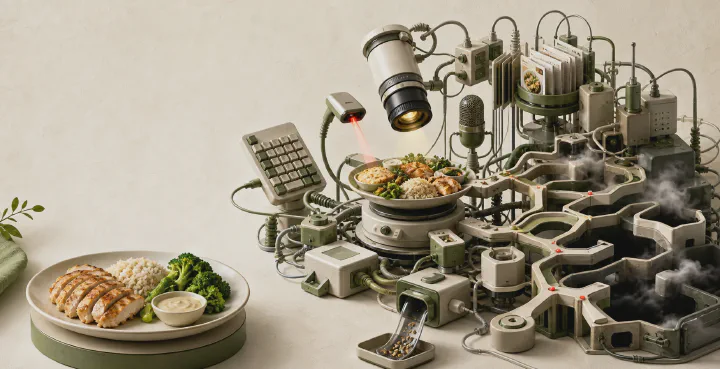
An ordinary tracker brings an entire army to the diary: search across millions of rows, barcodes, photos, voice, recipes, recent foods and favorites. Many apps do those things genuinely well.
Stated food-database sizes
Ready building blocks for your meals
Calk 2,100+ ingredient options raw · boiled · baked · fried · and moreCompetitors show company-stated search-database sizes. Calk counts prepared ingredient options, including cooking methods. Checked 14 July 2026.
On a feature checklist, Calk loses before the contest begins: it has no barcode scanner, photo AI, voice logging or millions of search results. We left those input methods out deliberately.
We will compare four familiar ways to log food: database search, photo, barcode and recipe. Then we will show what Calk uses instead.
1. Database search: more is not the same as better#
A database with millions of entries increases the chance of finding a familiar name. It does not tell you whether the recipe, preparation and serving match.
A search for “chicken curry” can return all of these at once:
Search: chicken curry
These are not four versions of the same food. The recipe, side, unit and serving size change from row to row; the user chooses which row fits. Millions of rows widen coverage, but do not remove that choice.
2. A photograph: a different door, the same missing information#
From a single photo, strong models are off by 20–36% of a dish’s calories on average; in the NIH test four consumer apps came in 27–38% short on a typical meal. The research behind these questions is in photo calorie counting: how accurate is it: 18 accuracy tests on one chart and an open dataset of 164 sources.
The camera sees the plate; AI recognizes the food.
Replace a wrong item, add what was missed, choose preparation and fix the portion.
A cucumber is easy to recognize. Pasta does not reveal its flour or how much oil the sauce carries. A creamy soup does not disclose the cream-to-stock ratio. Shawarma does not show what is under the top layer. A model that labels several distinct dishes simply “Korean food” has recognized a cuisine, not the meal.
Naming the dish is the easy half, and even that is not free. In a randomized trial of 42 young adults in Taiwan working from a fixed menu of 17 dishes, the image-recognition version of a research app reported 189 of 220 dishes (86%) correctly; the voice-input version it was tested against managed 136 of 200 (68%). Participants could pick an alternative, add a missed dish and correct names, ingredients, cooking methods and portions along the way. One dish in seven still came out wrong — on a closed menu, in a study that never measured calories at all.1 A systematic review of image-based dietary assessment found a wide spread of errors, with simple foods handled better than composed dishes.2
SnapCalorie states plainly that it estimates hidden oils, cooking fats and sugars from averages, visual cues and user input.3 That is a reasonable engineering strategy. An average does not become an observation merely because a camera proposed it.
And when the camera is wrong, it does not finish the job. In many apps you go back to a large database, pick the right chicken breast or cheese out of several entries, add the sauce it missed and fix the preparation and the amount. Even when an app builds an estimate without selecting a stored row, the parts still come back to you for correction. The camera has not removed the old work; it has proposed the first version.
You cannot know in advance how much work will remain after the photo. One plate may work perfectly today; a similar plate tomorrow may need several fixes. The correction tax is a lottery: it is hard to build muscle memory around a workflow that changes with every guess.
3. A barcode can win—and still not solve the problem#
Take the best case. A familiar supermarket yogurt appears on the first scan, the record is current, and the label has been transcribed correctly. For the values printed on that package, a successful scan can be faster and more specific than Calk.
But a scanner performs a lookup, not a chemical analysis. Four separate things still have to line up after the camera sees the code:
The apps say as much themselves: MyFitnessPal’s database mixes its own entries with ones members submitted, and Noom warns that not every food or barcode is in the system to begin with.4
In a 2018 study of seven apps and 100 products from two Dutch supermarket chains, MyFitnessPal correctly identified 96 products. Among those products, energy was available for 98%, and 89% of the available energy values were within 5% of the label. Sugar was available for only 50%, and 54% of those available values were within 5%.5 A scan can therefore retrieve a record that is incomplete, incorrectly transcribed or out of date.
There is no universal “complete label” behind a barcode#
A scanner cannot create nutrients that were absent from the label or database. And the mandatory core of a nutrition label depends on the country.
Compare the mandatory label fields in ten major markets
| Market | Baseline mandatory information for most ordinary packages |
|---|---|
| United States | calories; total, saturated and trans fat; cholesterol; sodium; carbohydrate; fiber; total and added sugars; protein; vitamin D, calcium, iron, potassium |
| European Union | energy; fat; saturates; carbohydrate; sugars; protein; salt |
| United Kingdom | energy; fat; saturates; carbohydrate; sugars; protein; salt |
| Canada | calories; total, saturated and trans fat; cholesterol; sodium; carbohydrate; fiber; sugars; protein; potassium, calcium, iron |
| Australia / New Zealand | energy; protein; fat; saturated fat; carbohydrate; sugars; sodium |
| Japan | energy; protein; fat; carbohydrate; sodium expressed as salt equivalent |
| South Korea | calories; sodium; carbohydrate; sugars; total, saturated and trans fat; cholesterol; protein |
| Brazil | energy; carbohydrate; total and added sugars; protein; total, saturated and trans fat; fiber; sodium |
| India | energy; protein; carbohydrate; total and added sugars; total, saturated and trans fat; cholesterol; sodium* |
| Mexico | energy; protein; available carbohydrate; total and added sugars; total, saturated and trans fat; fiber; sodium |
Checked 12 July 2026. These are baseline sets for most ordinary prepackaged foods; each framework has category, package-size and claim-specific exceptions. *In India, some lines apply when defined composition conditions are met.
A Japanese label can comply with a five-field mandatory core; a barcode database may contain more. The European mandatory core is broader, and the US one broader again. The point is not that labels necessarily lie. The mandatory minimum depends on the country.
Errors also occur inside regulated systems. In a Canadian laboratory study using CFIA samples collected from 2006 to 2010, 169 of 1,010 products (16.7%) were rated “unsatisfactory”: a lab value for at least one tested nutrient exceeded the label by more than 20%. The nutrient-specific rates were 18.4% for sodium (49/266), 14.2% for calories (31/219) and 15.8% for saturated fat (60/380).6
Millions of codes therefore solve “find the package,” but do not guarantee equally deep composition data. MacroFactor publishes both numbers side by side: about 1.36 million verified searchable foods, and roughly 26,500 common foods with a complete micronutrient panel.7
4. A recipe calculates the pot. You ate a plate.#
If you know the ingredient weights, finished yield and your share, a weighed recipe gives you tight control over the calculation. For gram-level control, you need to know:
The standard advice is to weigh the dish after cooking, because a pot loses water on the stove and the raw weights no longer add up. Good advice—if you want and can keep the process running every time you cook.
Then your partner eats most of the meat. A child leaves the side. Sauce remains in the shared bowl. Oil stays in the pan—or does not. Yesterday’s “four portions” become three large plates and one small container.
meat · grain · vegetables · oil · sauce
meat was taken · sauce remained · portions differed
less meat · usual side · a little sauce
Instead of a fifth input method: a meal template#
Search, barcodes, photos and recipes have different strengths. But each route first creates an entry and then asks the person to explain how today’s food differs from it. Calk changes the starting point rather than the input method: instead of an empty diary, it opens one editable model of a familiar meal.
That makes sense because diets repeat more than they appear to. In an analysis of 21,006 adults who logged foods and drinks for 10–14 days, for half of users nine items accounted for half of everything they logged, and 35 accounted for 90%.8
Calk uses a database too. But instead of millions of search candidates, it contains 2,100+ prepared ingredient options, including cooking methods. Raw, baked and fried salmon are separate because preparation changes the calculation. Within baked salmon, however, there is one working choice: data for pesto salmon, species with a different fat profile and trout are not mixed into it. Calk does that sorting before the food reaches you.
For basic foods, the numbers come from national food-composition tables and scientific papers. One source may supply strong macros, another iodine, K2 or fatty acids. Calk combines only fields that describe the same food and preparation. Labels are used separately to validate packaged foods—where salt, sugar, saturated fat and fortification belong to the specific product. The main source groups are listed below.
A ready-made form for choosing meal details#
Take a bowl:
You choose the oil, sauce, preparation and portion; where relevant, you can also specify salt, sugar and fiber. All the choices are visible on screen. Change one detail and the whole meal recalculates while the other choices stay put.
Templates live on three customizable screens. Arrange them so familiar meals are always in the same place. Here is how that looks in the app.
One bowl, two scenarios
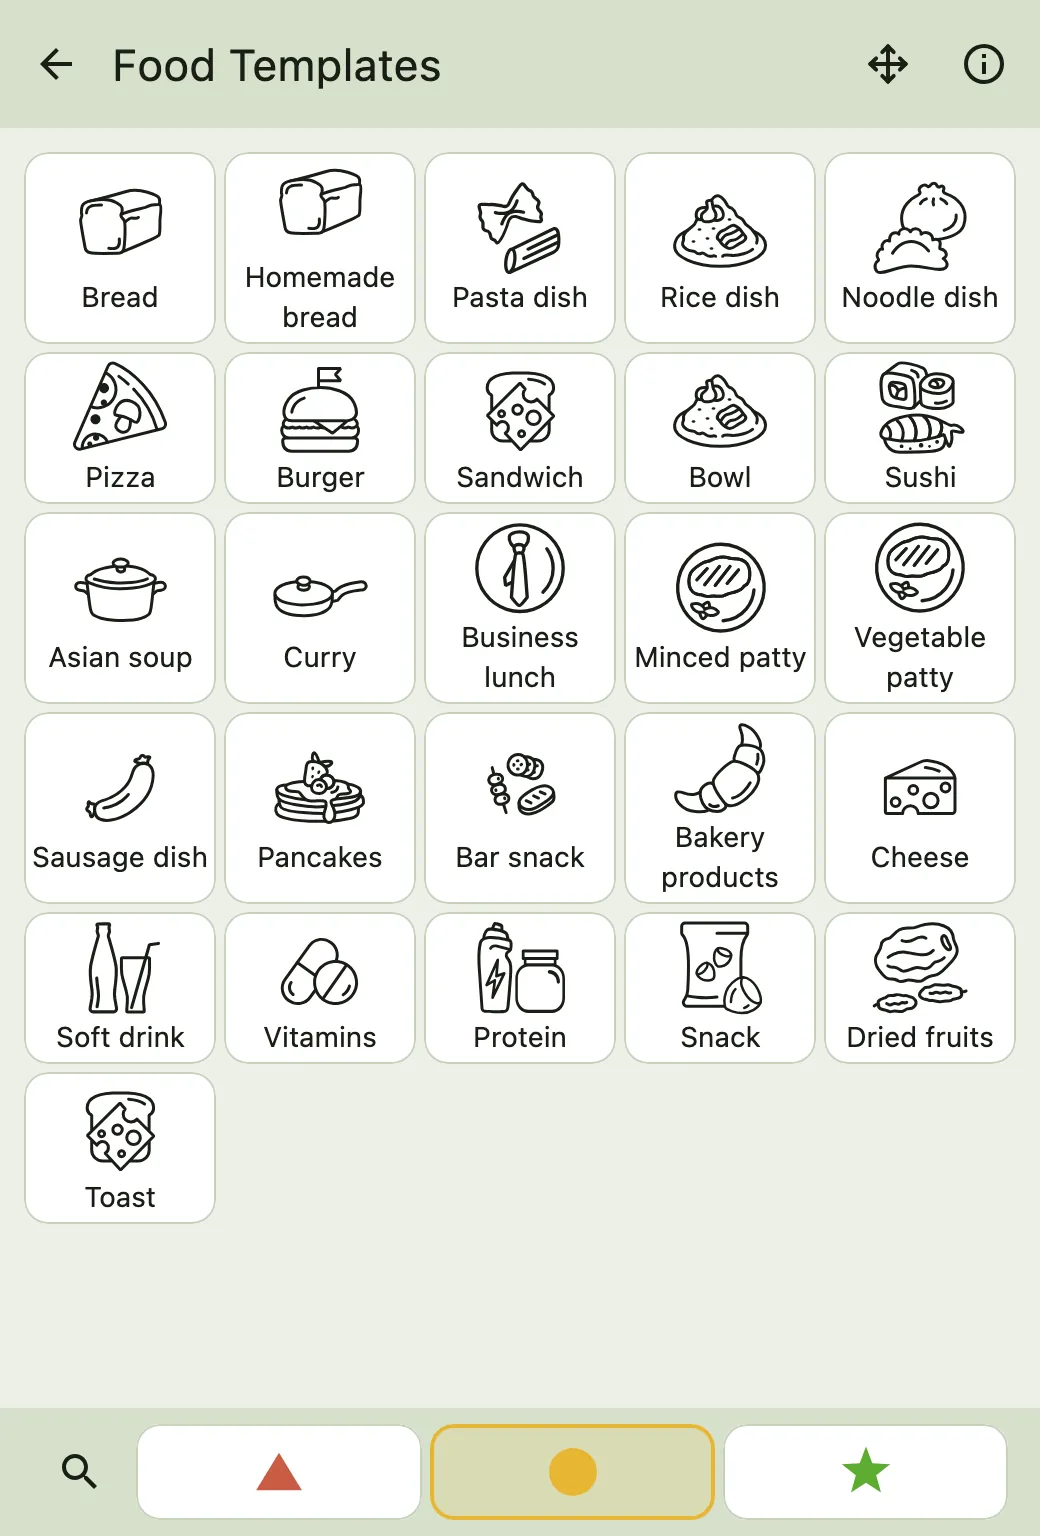
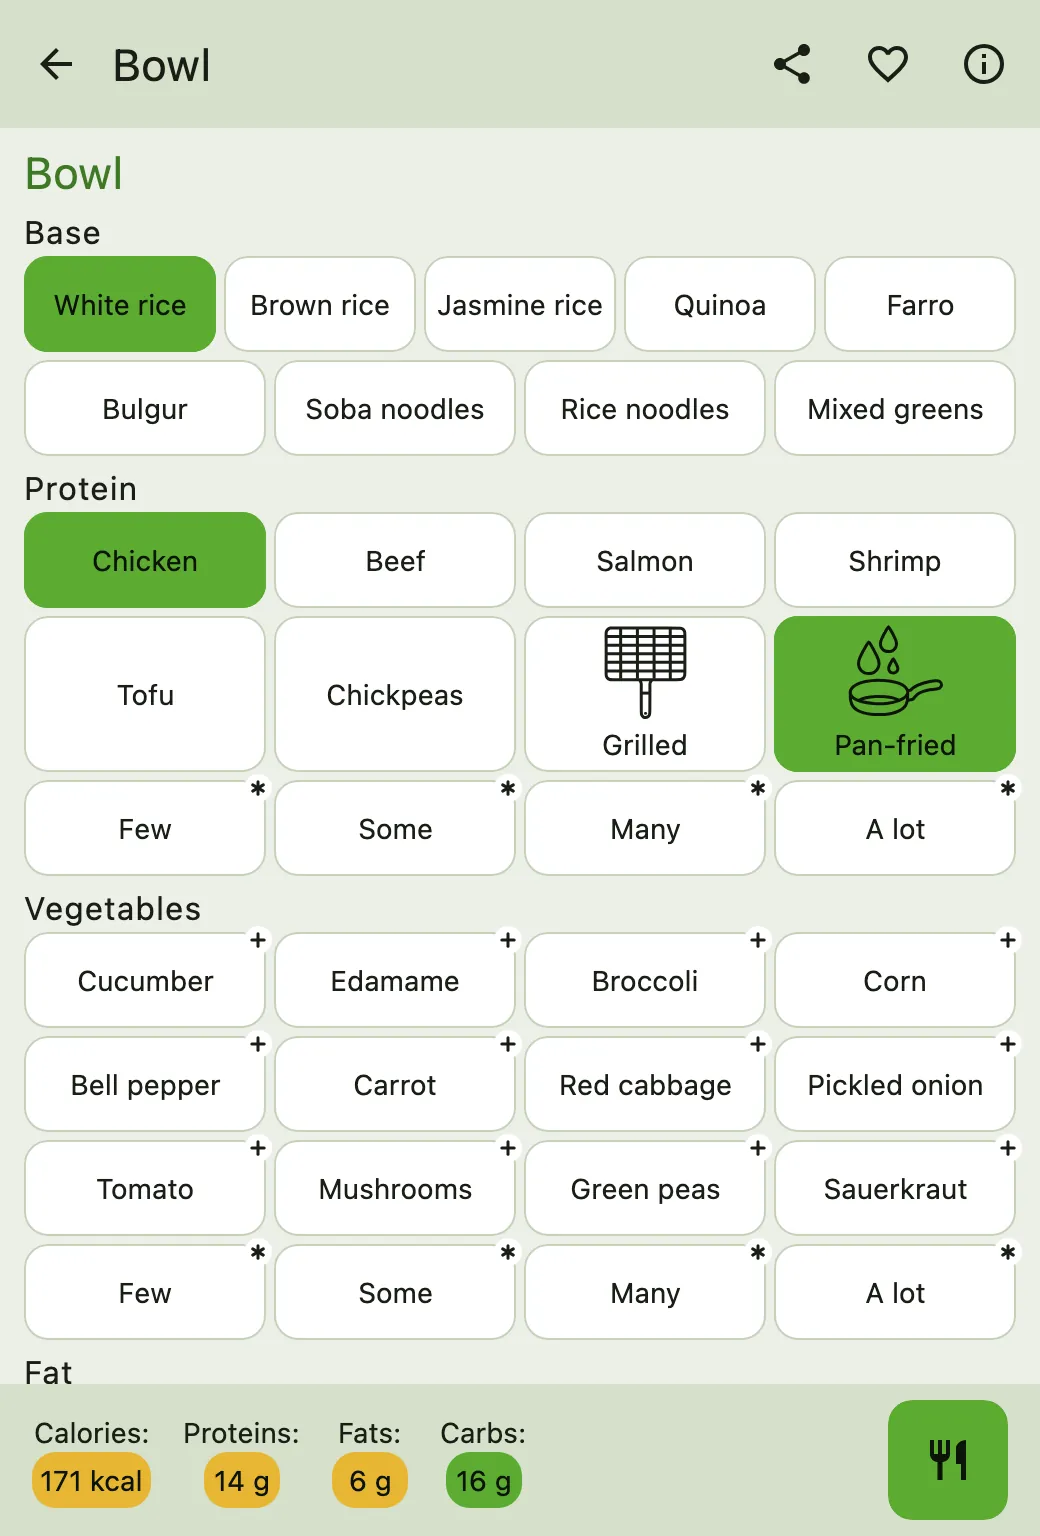
The other choices did not change.
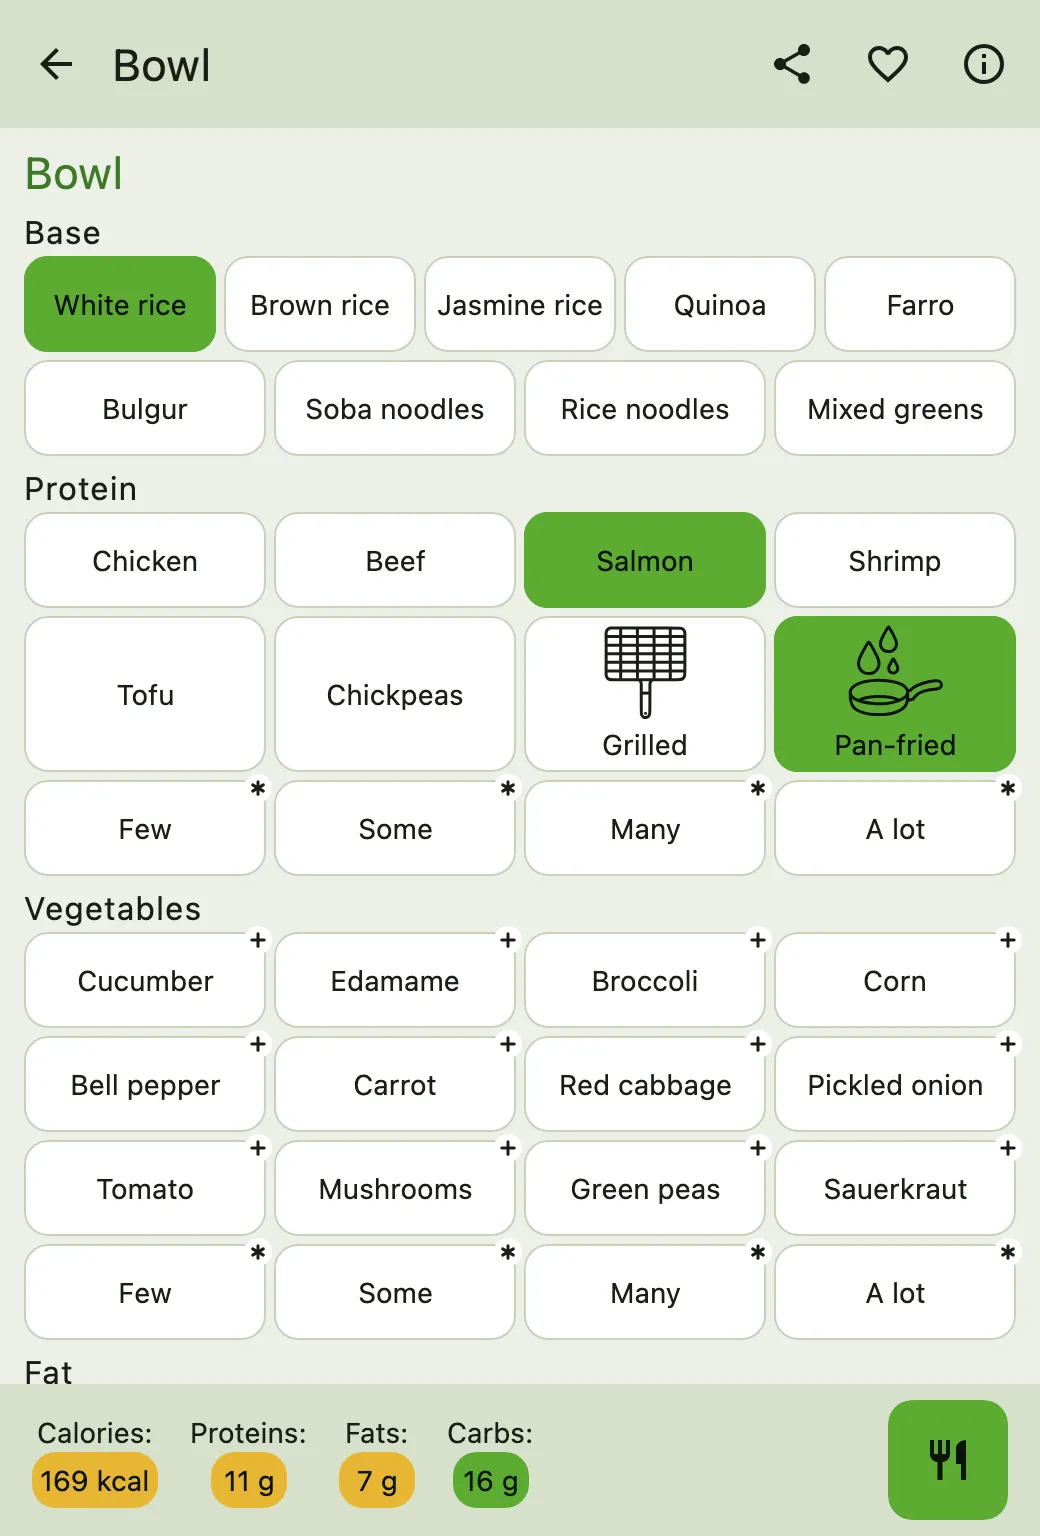
Calk does not reconstruct how a shared pot was divided after the fact. But if your plate had less meat, the usual side and a little sauce, those parts can be changed separately and the plate recalculated.
When measuring is awkward from the start#
A restaurant, banquet, office party, hotel breakfast, bar, beach or airplane is not a dish. It is a situation in which food arrives in waves, gets mixed and shared, and is poorly remembered.
For many of those situations Calk has dedicated templates. These are examples of meals they let you assemble quickly:
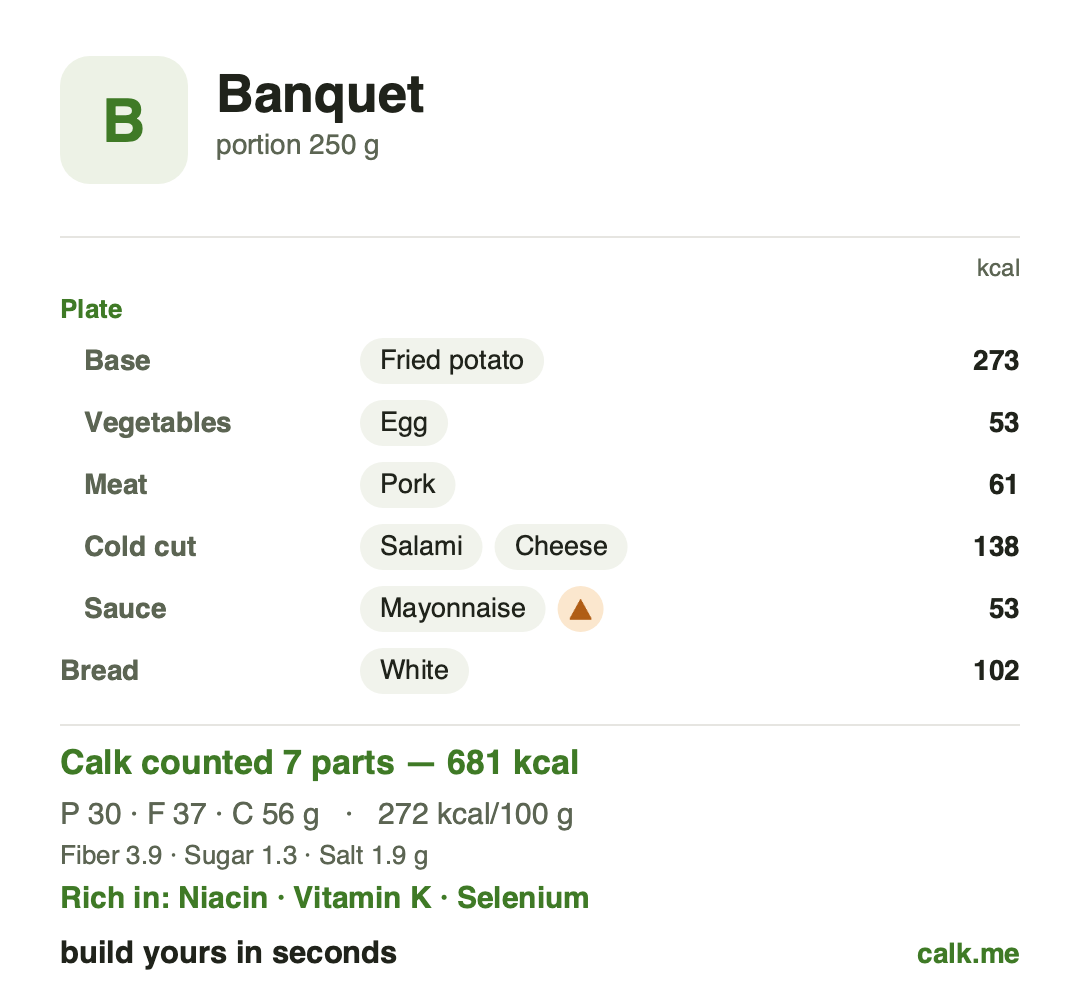
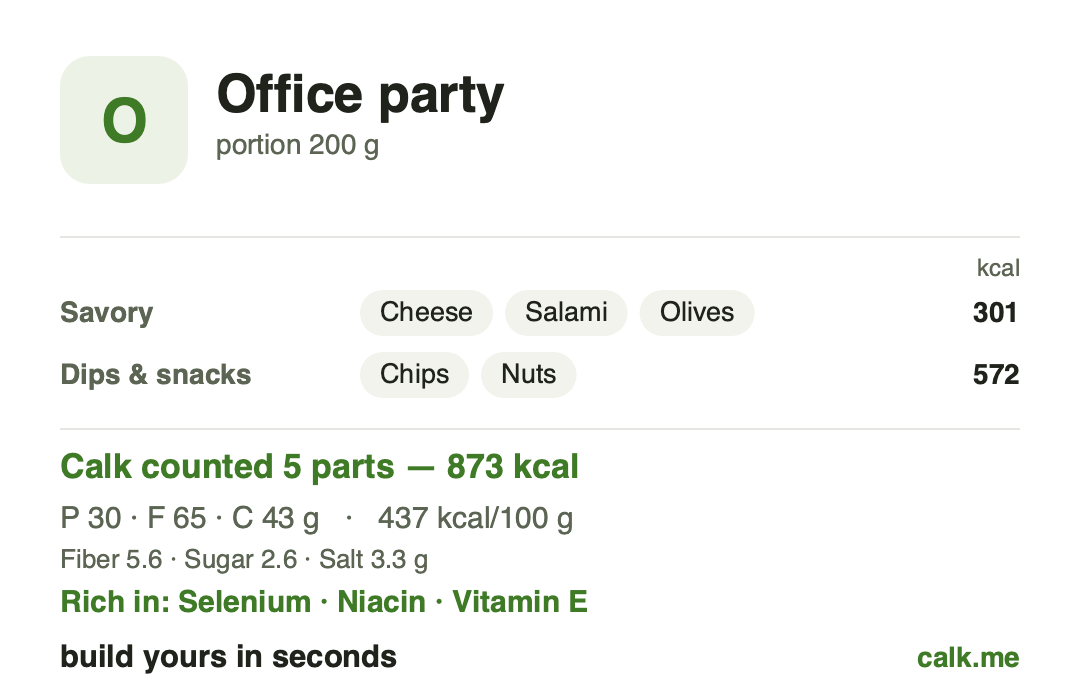
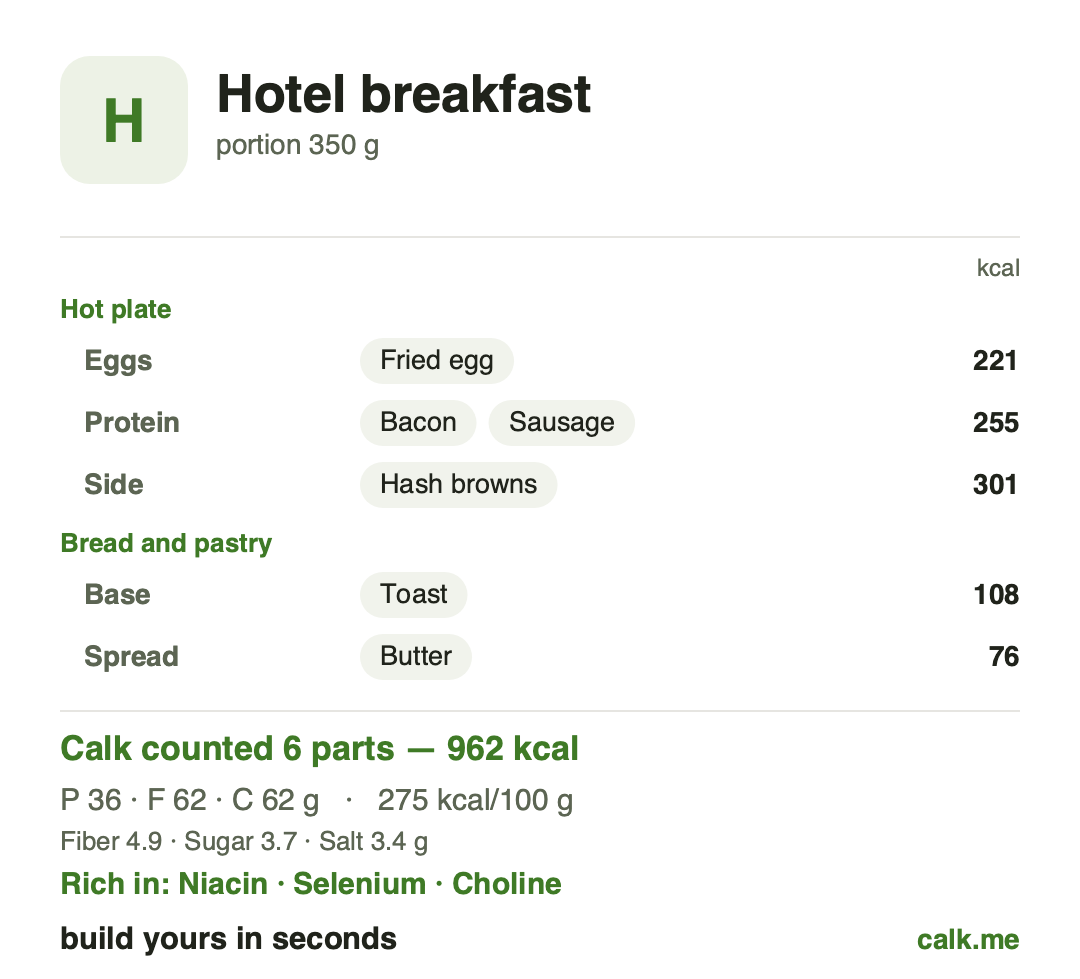
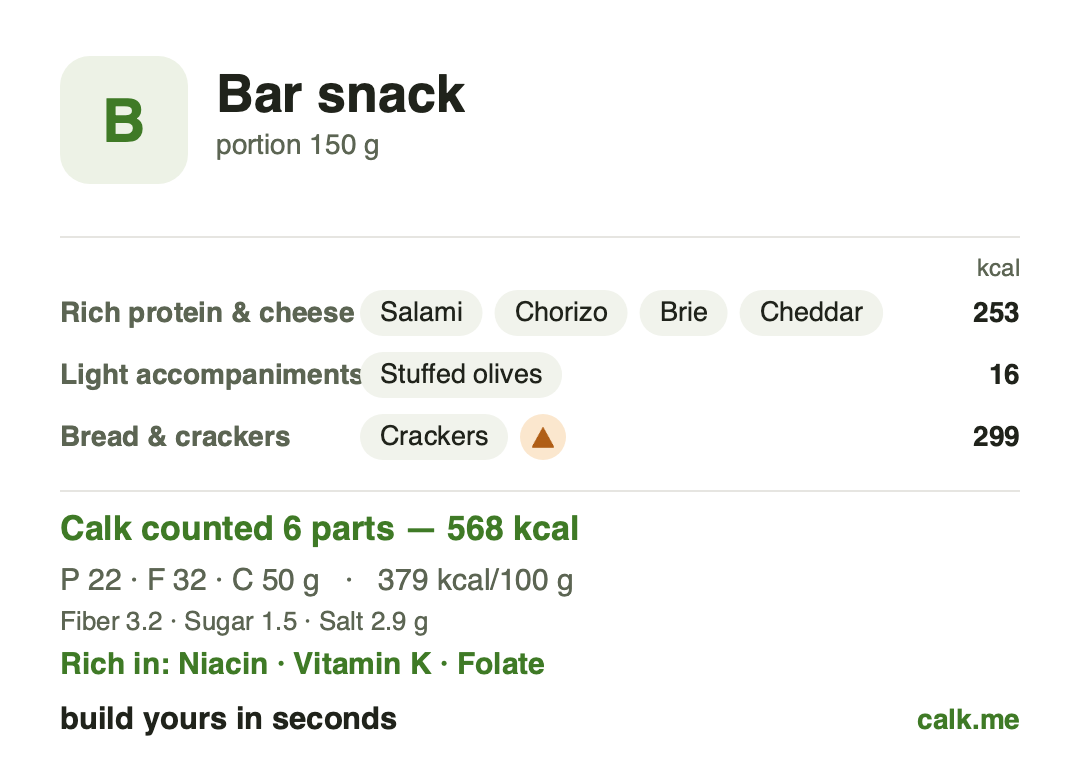
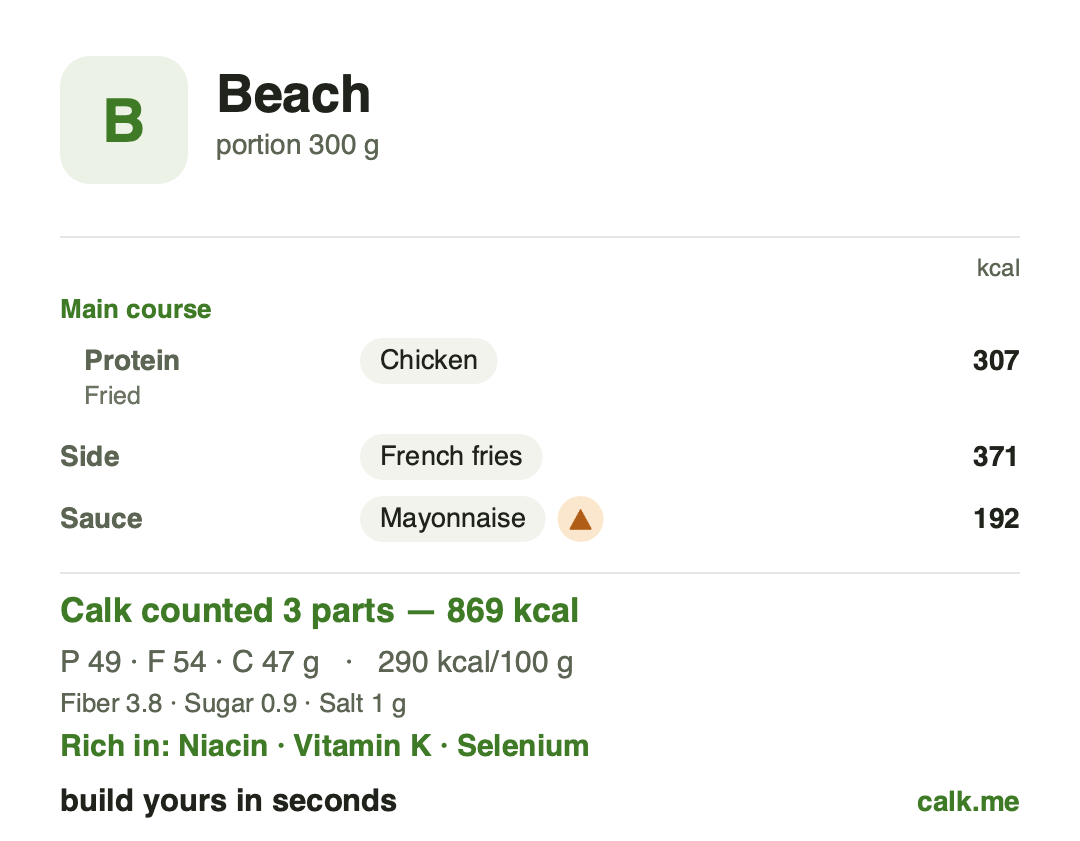
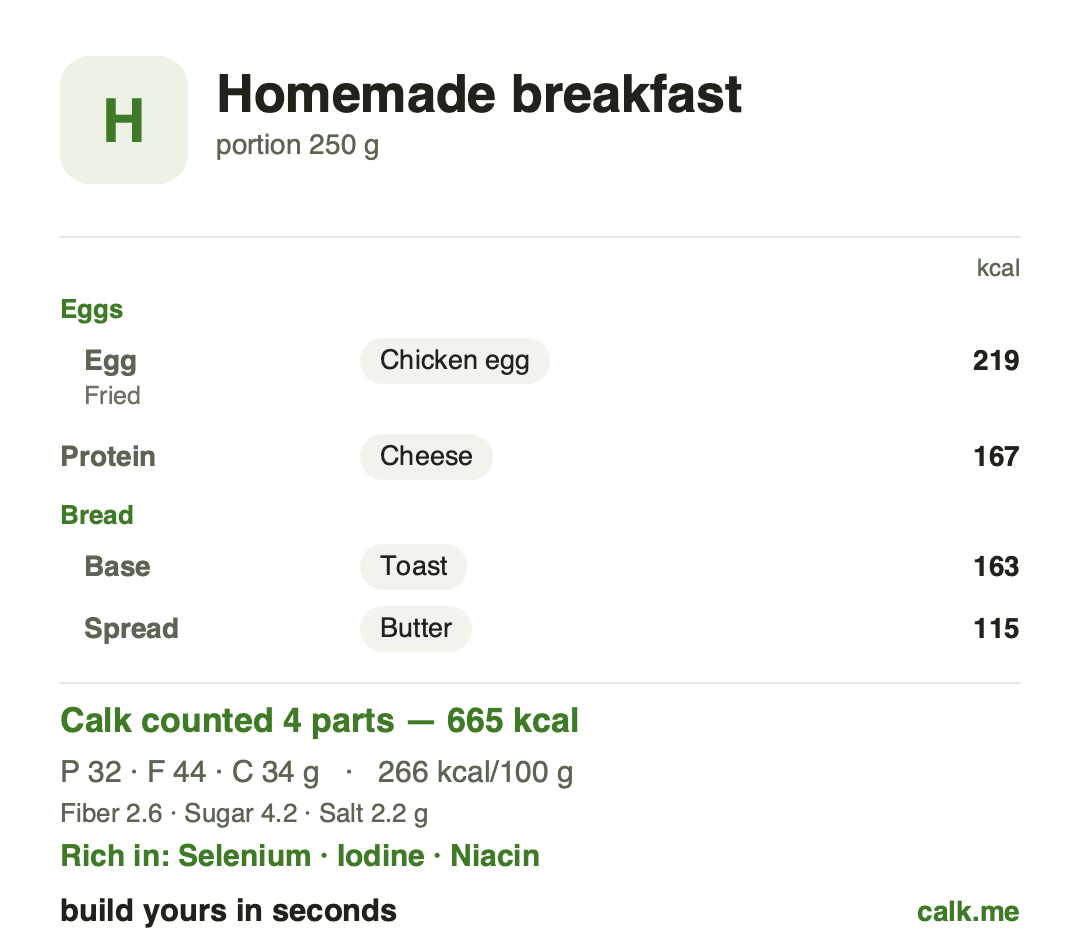
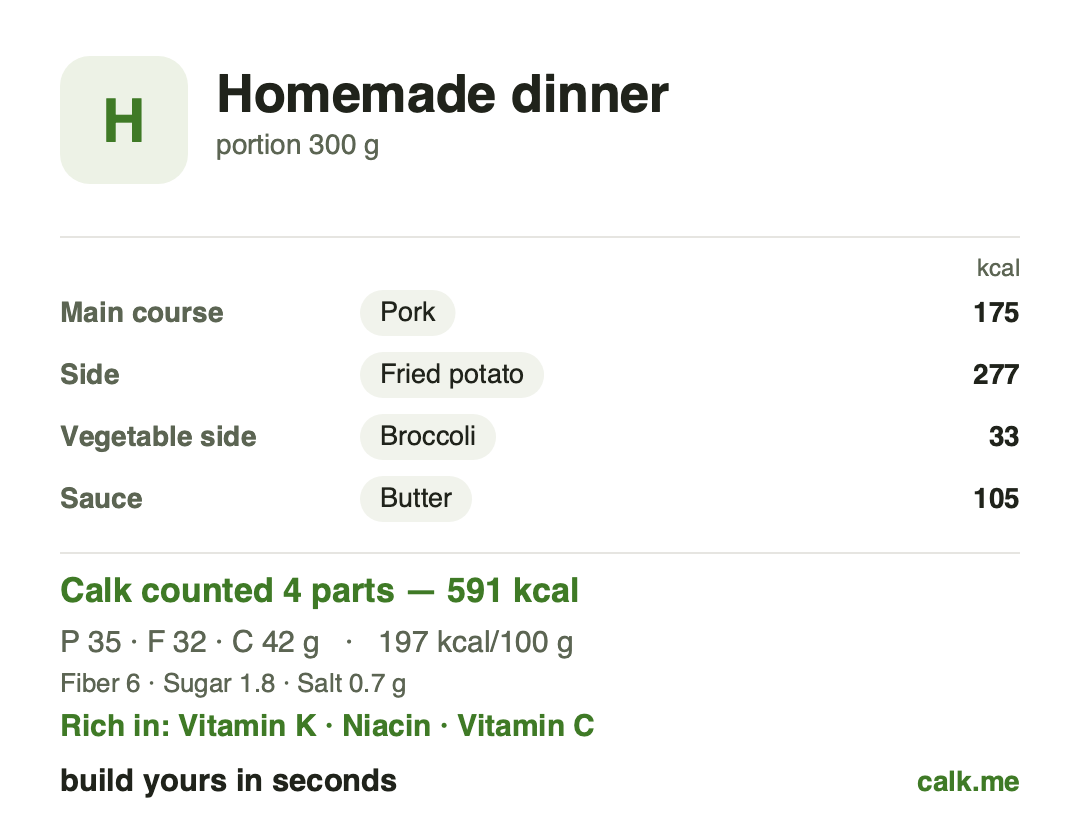
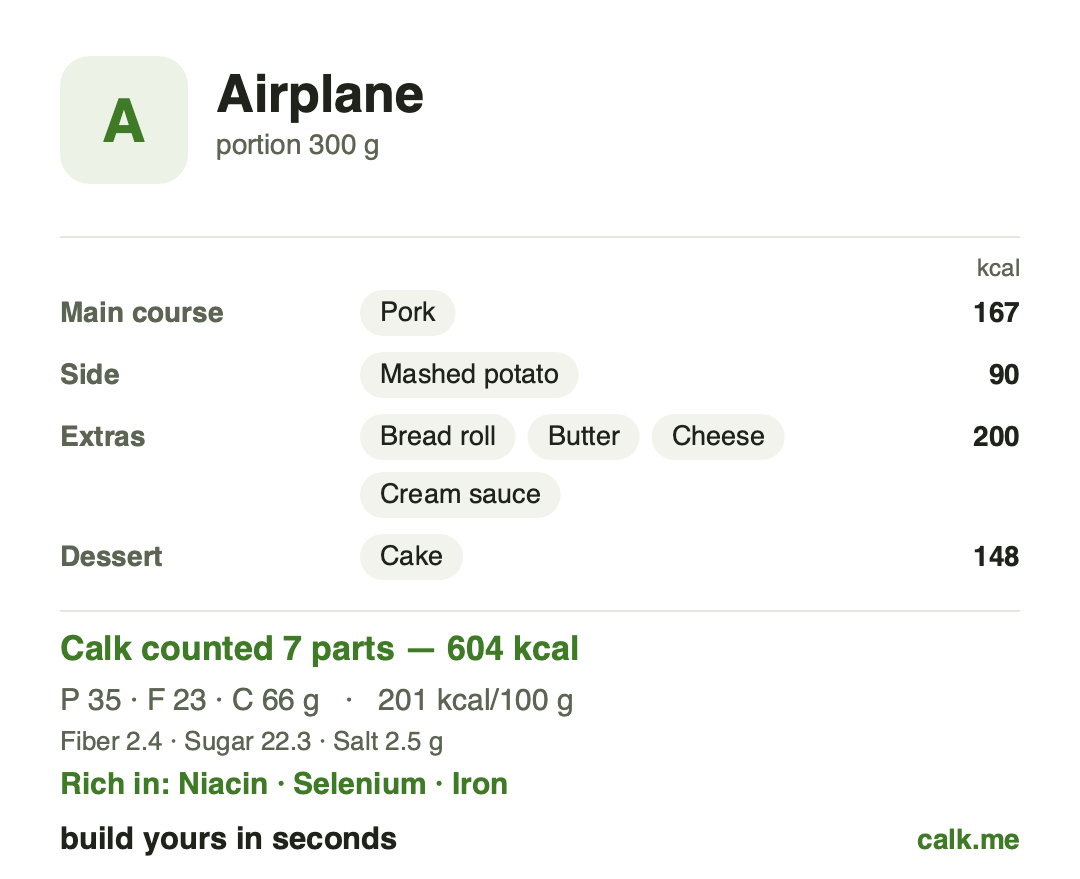
The banquet template builds its estimate out of the parts and portions you actually pick, so you can log the evening while you still remember roughly what was on the plate.
What meal templates make possible after a month#
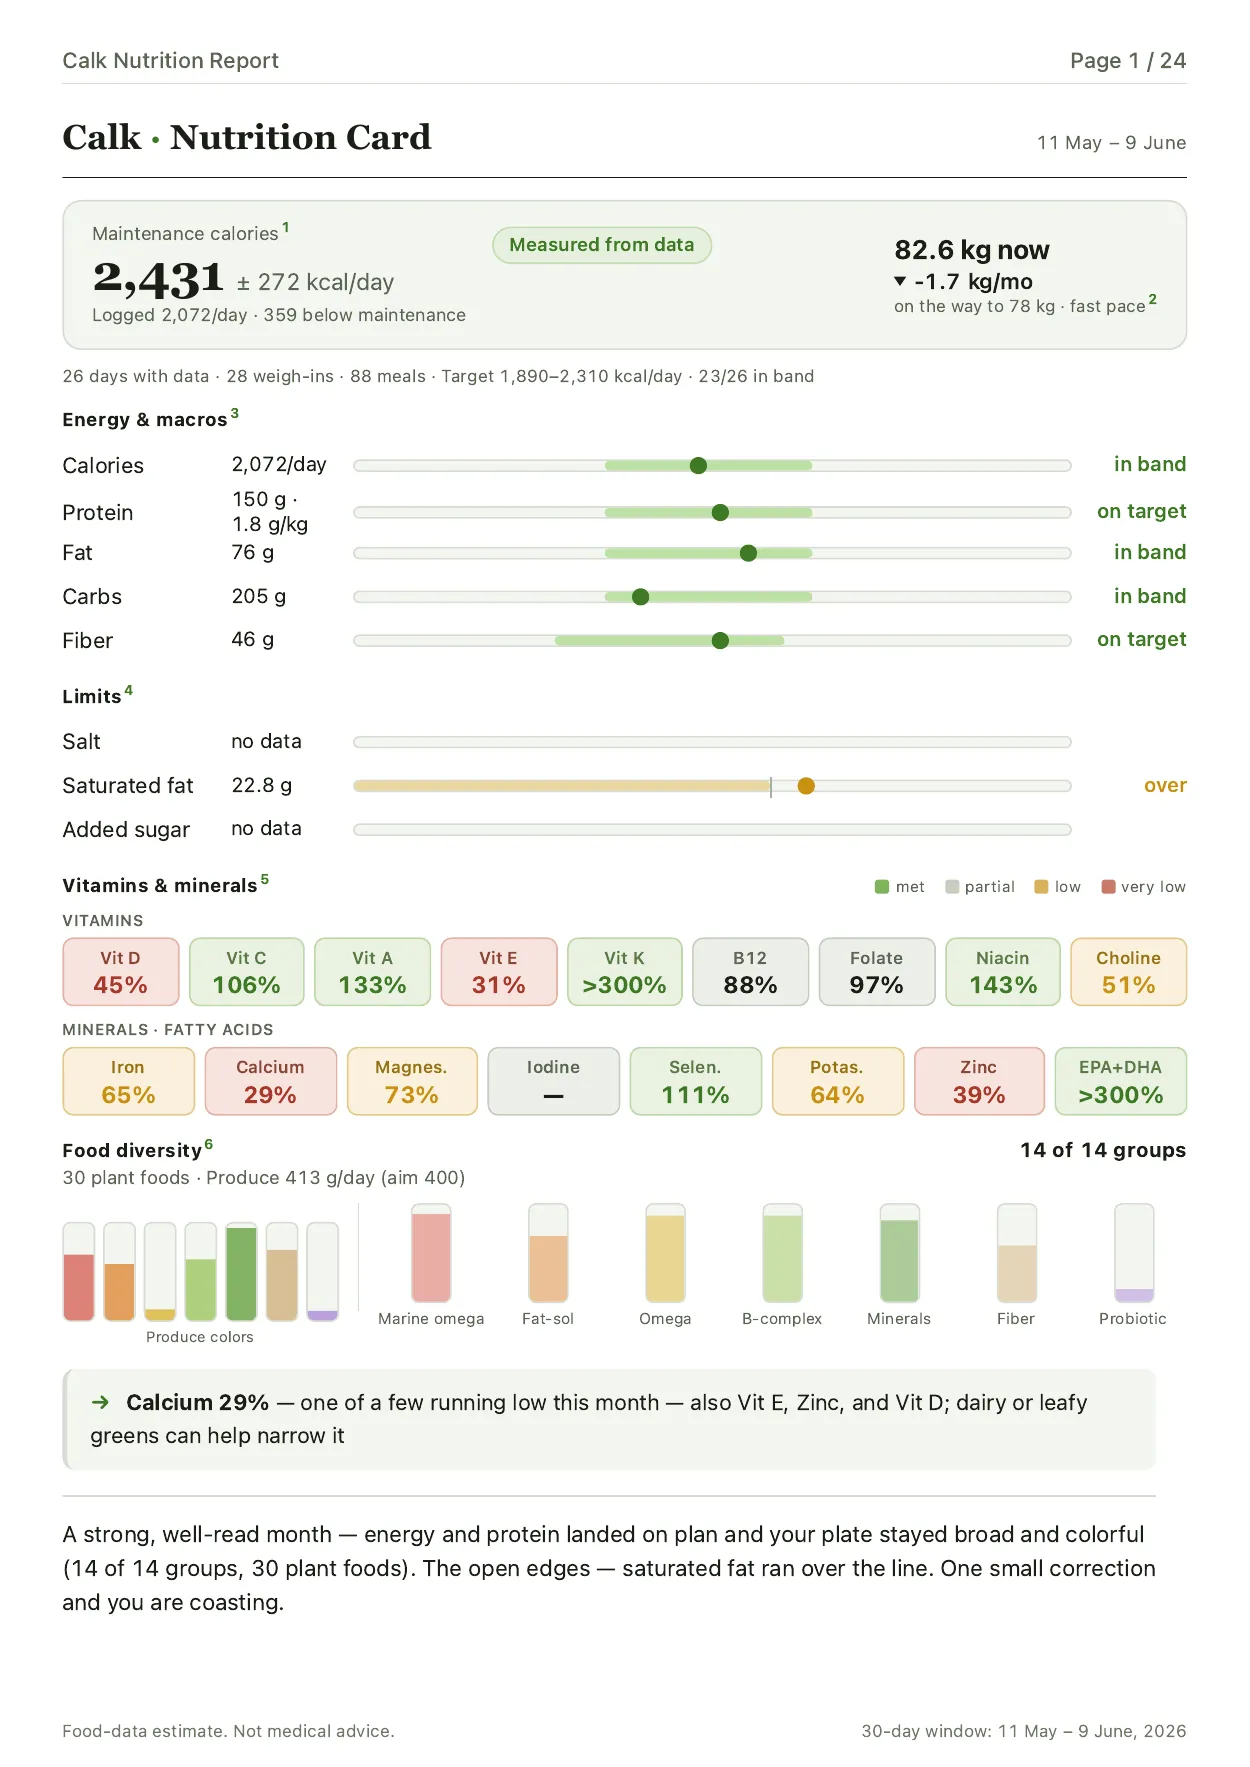
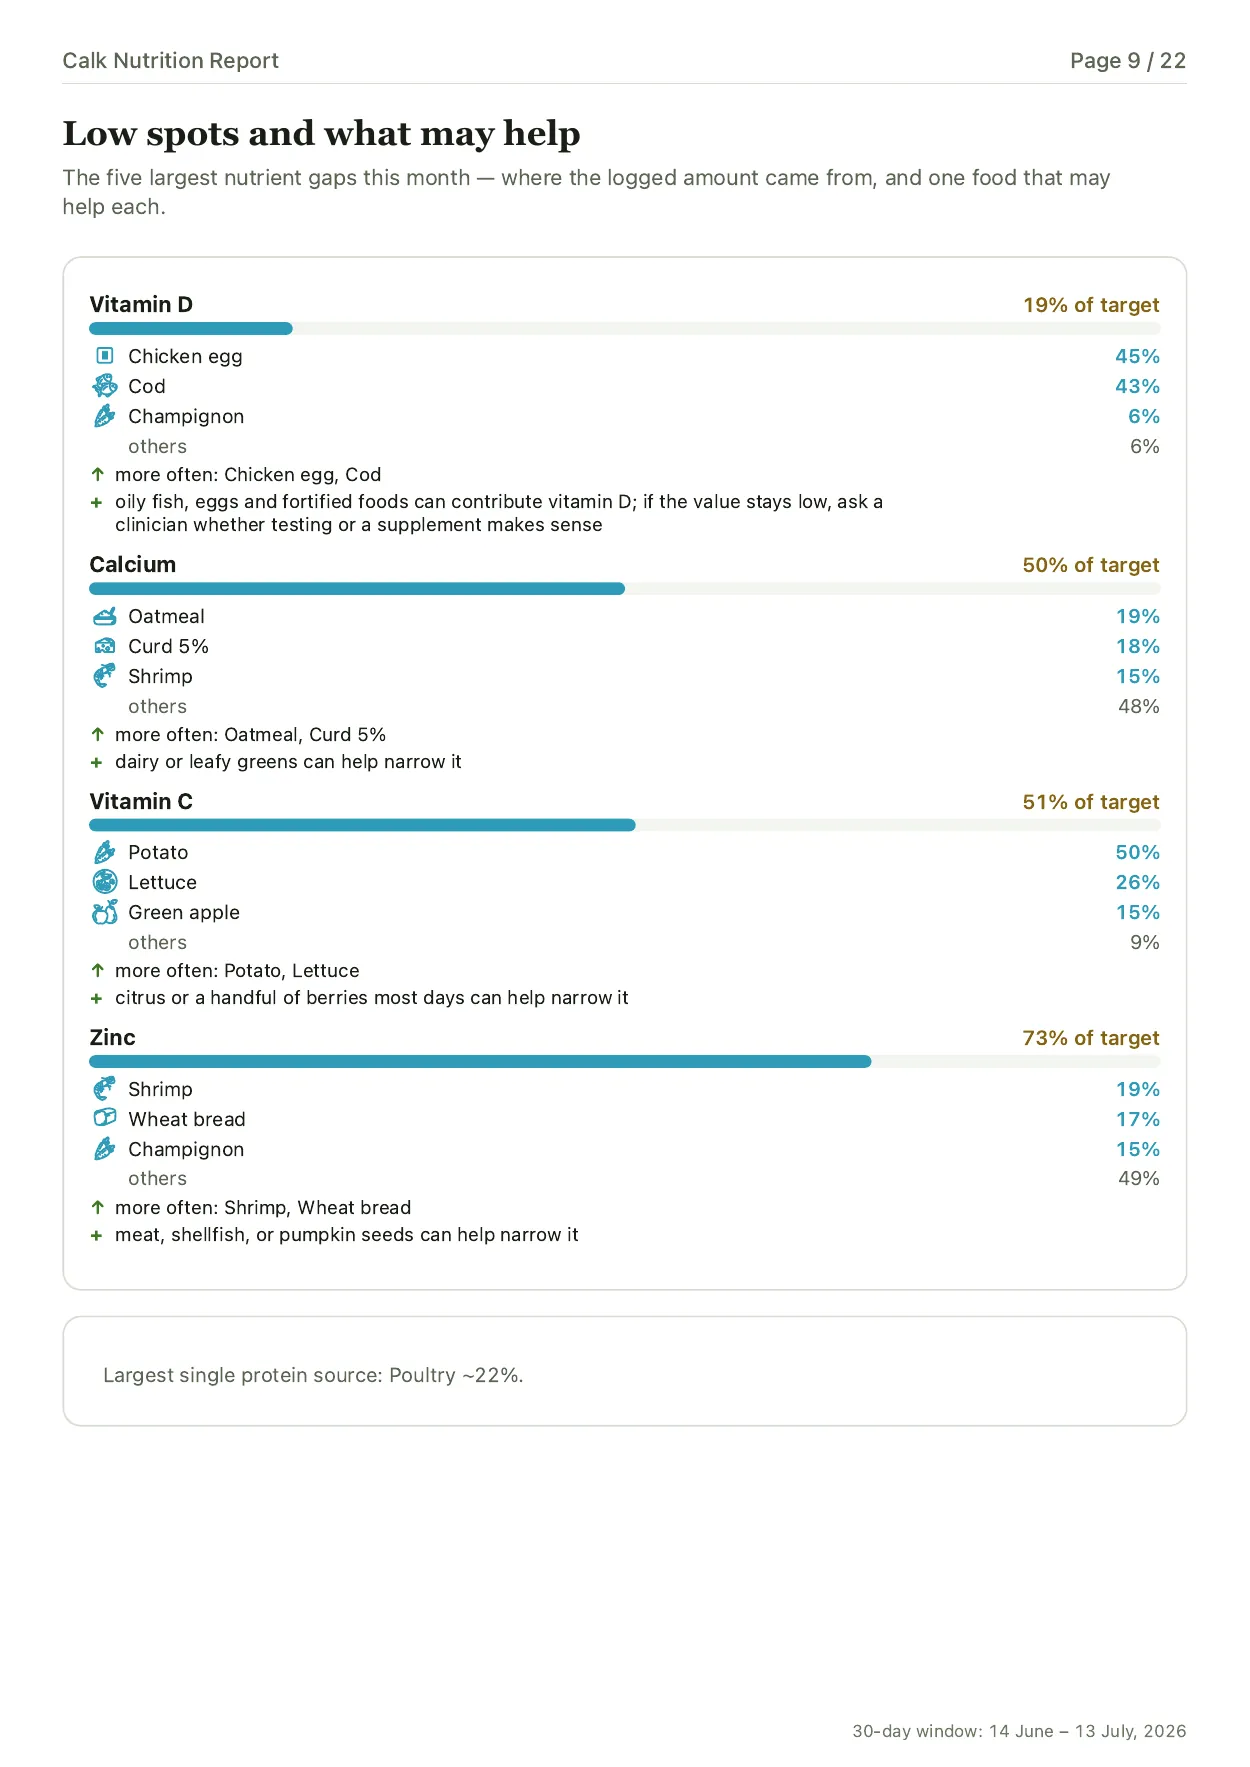
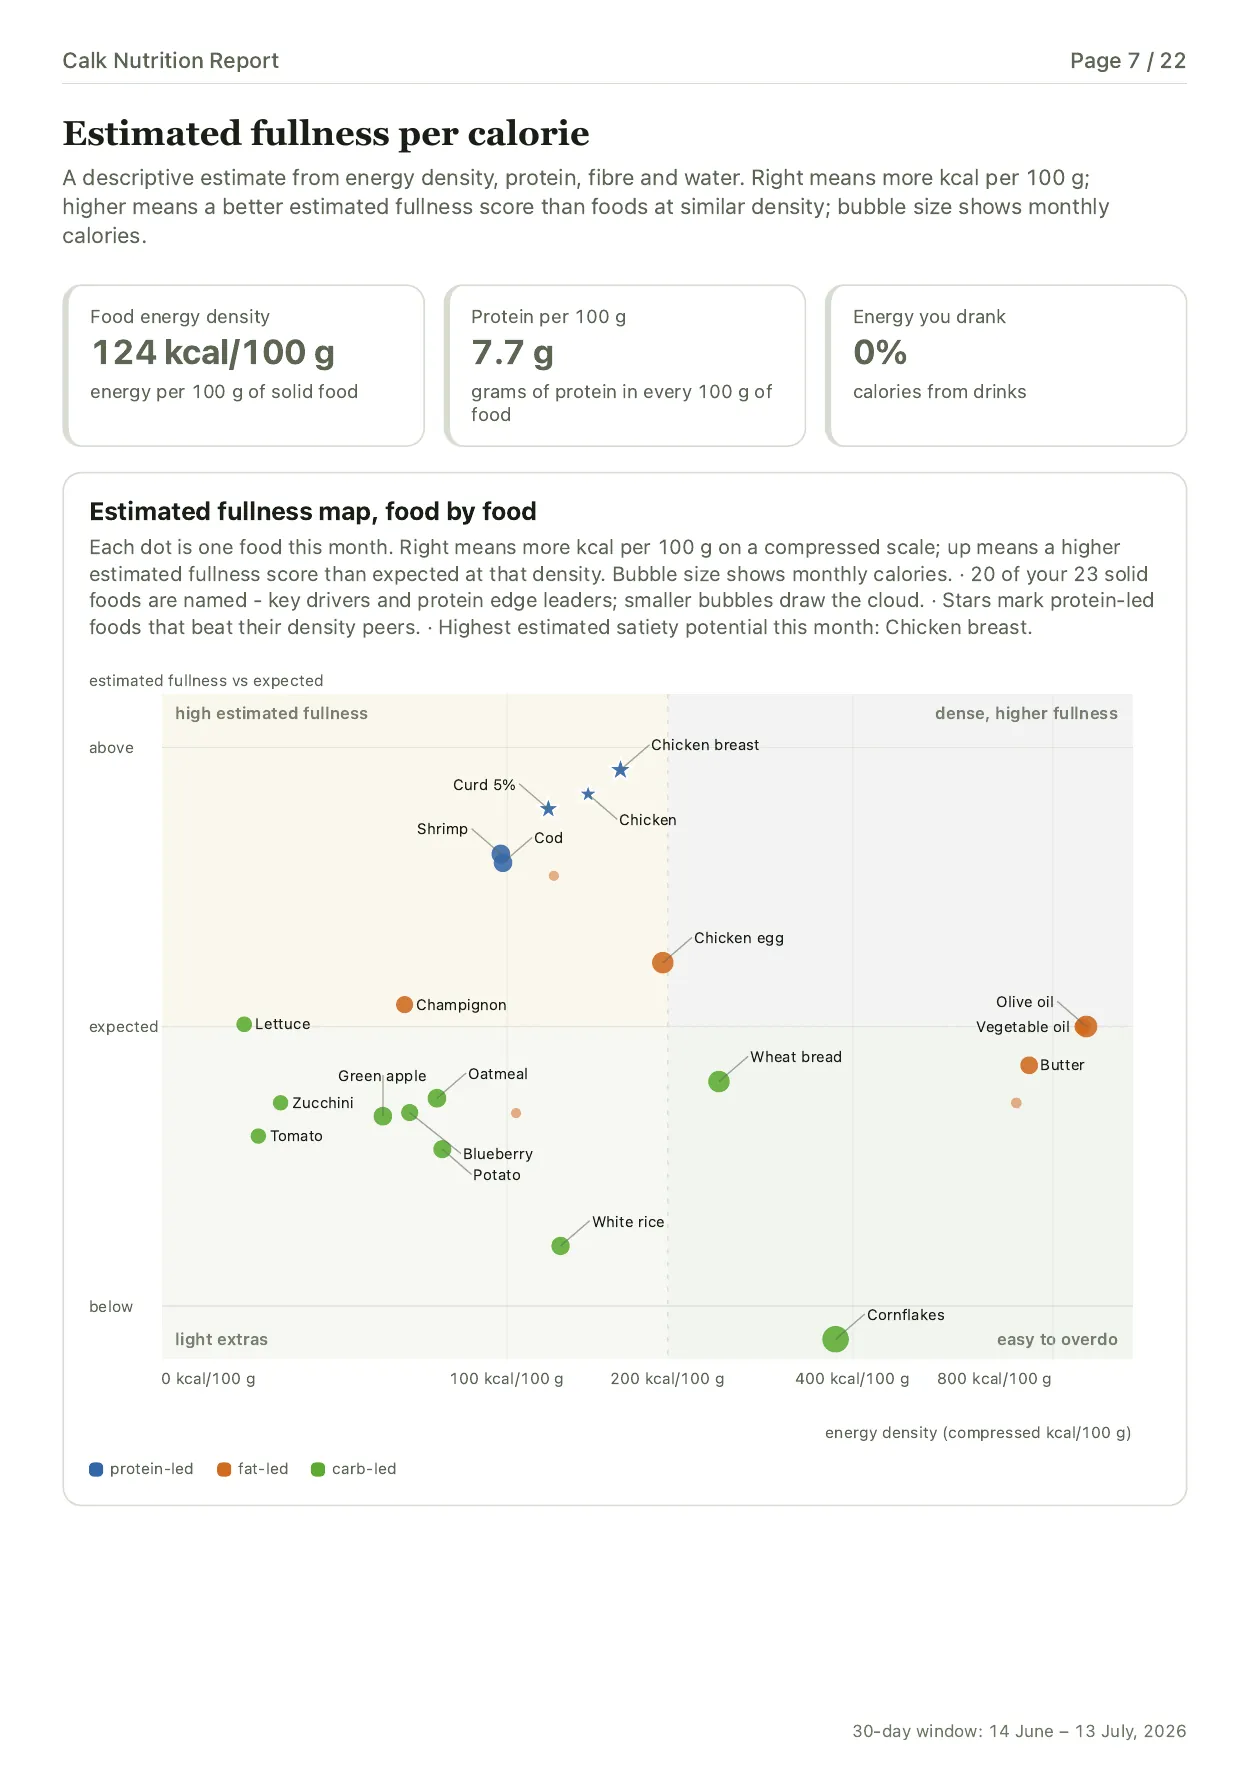
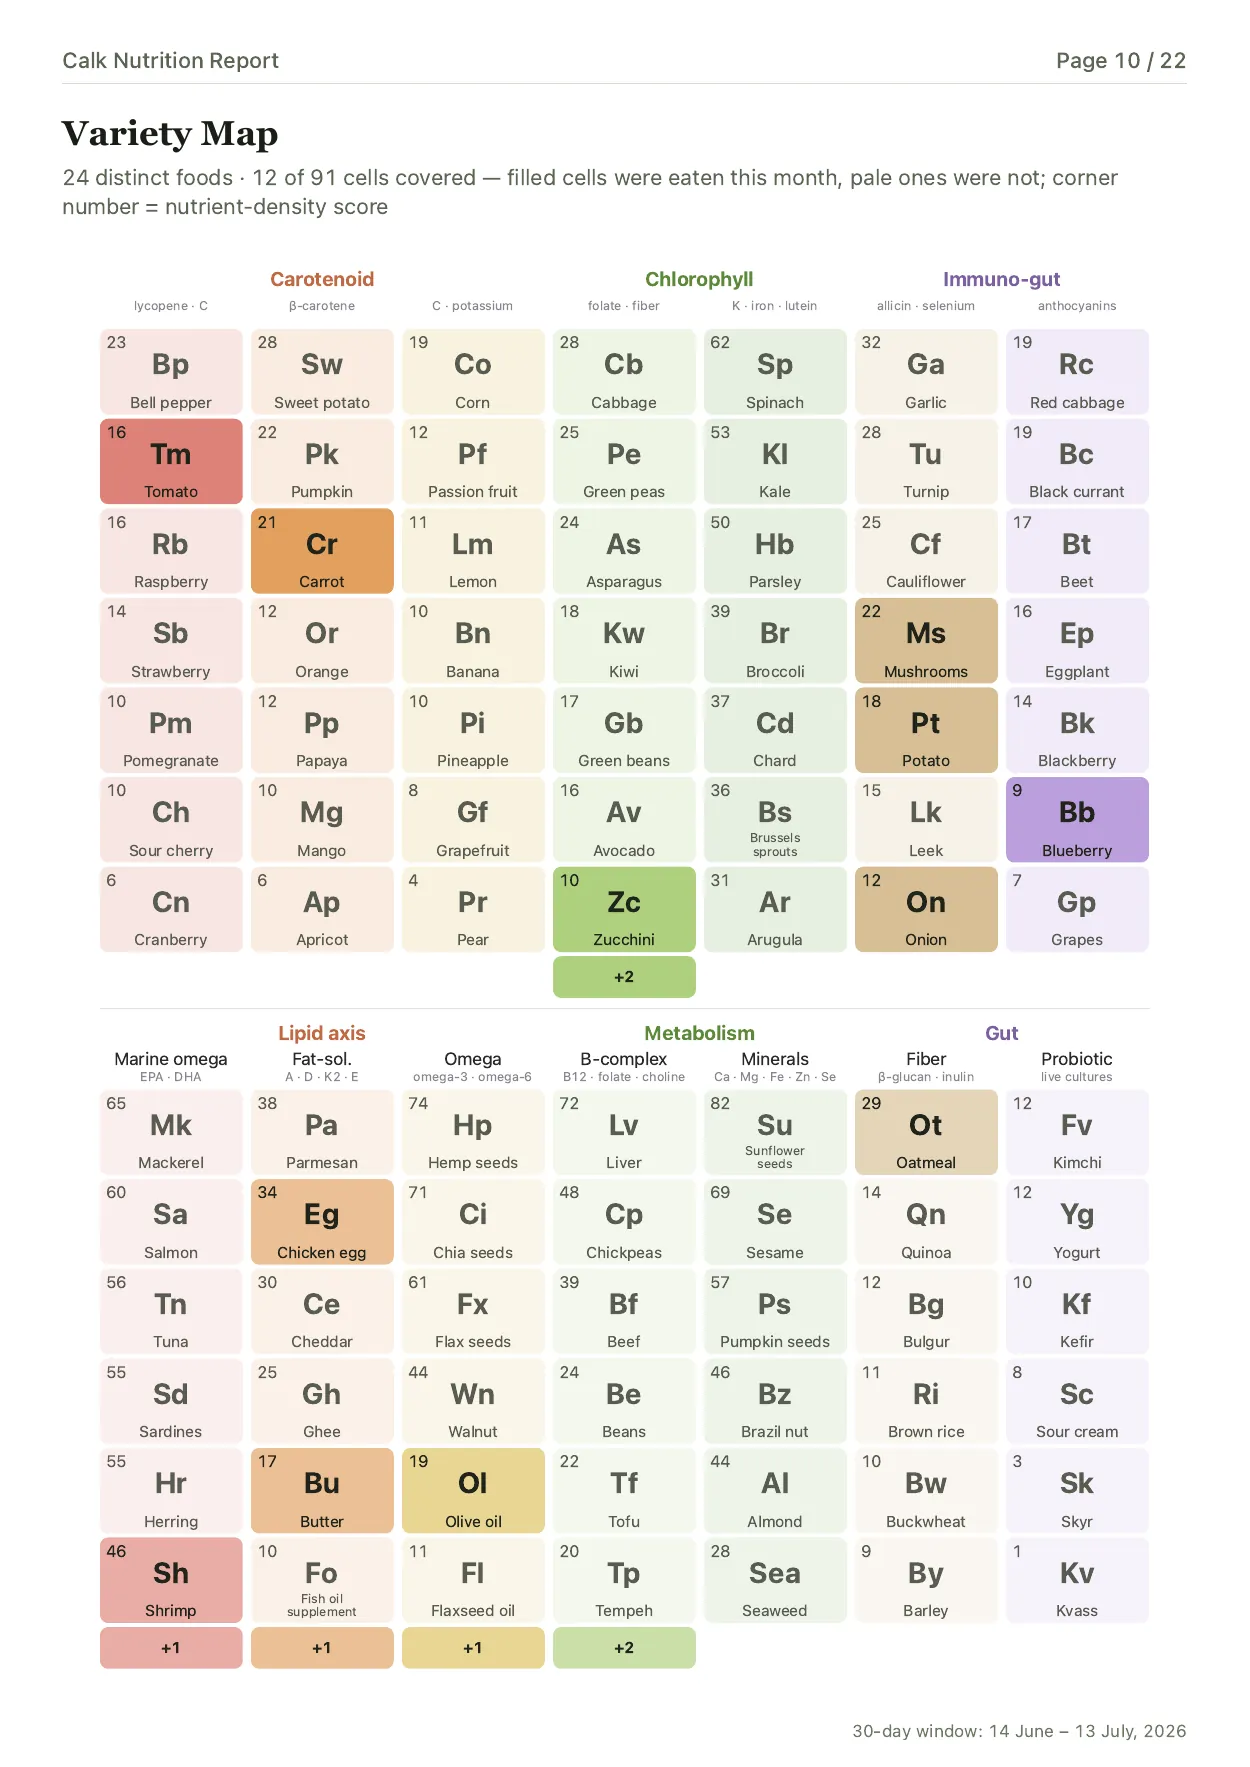
A template is not only for fast input. It preserves more than a meal name and calories: its ingredients, preparation and chosen portion remain in the diary. Food observations start reading your recent entries right away; the monthly Nutrition Report waits for a month of them and then does three things:
The cover brings the month together; the nutrient review shows which foods supplied the logged amount and one food-level way to narrow each gap.
Calorie density (kcal per 100 g) and estimated satiety are two separate measures. Estimated satiety follows the satiety index Holt and colleagues measured, with white bread at 100, plus Calk's estimates for similar foods: a property of the food, not a record of how full you felt.
The map shows which food groups appeared regularly and which were barely represented across the month.
 Open full size ↗
 Open full size ↗
 Open full size ↗
 Open full size ↗
If a meal went into the diary as one line with a name and a calorie total, no report can take it apart afterwards. The structure that speeds up the input is the structure that keeps the month readable.
Read the report and choose what to change in two or three of the dishes you repeat most often. Keep logging as you try the new versions; once every change is a habit, daily logging ends. Keep weighing yourself to follow the trend. You come back when the trend drifts — not because a streak broke, a day turned red or a notification asked you to. A week of food entries then fills “Food variety this week” again.
Where Calk gets its numbers#
A small catalog only earns its place if there is real work behind every entry.
One comparison checks a version of a Calk meal template against the oil used in a published recipe; another checks its protein and fat against a similar dish in a food database. The method is documented here.
The current source list contains more than 40 official food-composition datasets and identifiable scientific publications. For each ingredient, Calk takes the fields that were actually measured or published by sources that fit that food. One source may supply protein and fat, another iodine, and a paper may supply vitamin K2 or spermidine. Conflicts are checked, overly narrow or incorrect matches are rejected, and the app receives one clear default.
The databases actually used#
Open the country-by-country source ledger
| Country / region | Dataset | Role in Calk | Provenance |
|---|---|---|---|
| United States | USDA FoodData Central: SR Legacy, Foundation Foods and FNDDS | macros, micronutrients, validation | direct official downloads |
| United States | USDA / FDA / NIH Iodine Database; USDA Choline Database | iodine and choline cross-checks | direct official |
| France | ANSES-CIQUAL 2025 | macros, micronutrients, validation | direct official + local snapshot |
| United Kingdom | CoFID 2021 | macros, micronutrients, validation | direct official + local snapshot |
| Canada | Canadian Nutrient File 2015 | micronutrients, validation | direct official |
| Australia | AUSNUT 2023; Australian Food Composition Database, Release 3 | macros, micronutrients, validation | direct official |
| Norway | Norwegian Food Composition Table | macros, micronutrients, validation | direct official + local snapshot |
| Sweden | Swedish Food Agency database | micronutrients, selected cross-checks | direct official |
| Finland | Fineli | macros, micronutrients, validation | direct official + local snapshot |
| Denmark | Frida 5.5 | micronutrients, validation | direct official snapshot |
| Japan | MEXT Standard Tables of Food Composition | macros, micronutrients, validation | direct official + local snapshot |
| Netherlands | NEVO lineage | macros, validation | historical local snapshot |
| Czechia | Czech Food Composition Database / NutriDatabaze | macros, validation | local snapshot |
| Indonesia | TKPI-derived records | targeted micronutrient cross-checks | secondary reproduction |
| Russia | Skurikhin & Tutelyan tables through source-attributed Russian databases | limited macro cross-checks | secondary reproduction; not a full import |
“Direct official” means the current evidence registry points to an official dataset or cached official download. “Local snapshot” means the source is used through Calk's consolidated working layer; it does not claim the latest external release. Russian and Indonesian rows are not counted as direct official datasets.
It is not simply “USDA, done.” National tables are supplemented with manufacturer labels where fortification and added sugar matter, and with identifiable publications for rarely measured nutrients. Representative papers cover food polyamines, vitamin K forms in dairy, lutein and zeaxanthin and amino-acid composition.
What the nutrient layer stores#
| Group | Stored and calculated |
|---|---|
| Core | calories; protein; fat; carbohydrate; water; fiber; sugar; added sugar; salt |
| Fats | saturated, monounsaturated, polyunsaturated and trans fats; cholesterol; omega-3; omega-6; ALA; EPA; DHA |
| Minerals | calcium; iron; magnesium; iodine; selenium; potassium; zinc |
| Vitamins | vitamins A, C, D, E, K1, K2 and B12; folate (B9); niacin (B3); choline |
| Additional | caffeine; leucine; lutein; zeaxanthin; spermidine |
Your diary stays on your device#
Food logs, weight values, targets and reports stay on your device and are not uploaded to Calk's servers.
Food and weight logging works offline—on a plane, in the subway or underground.
Calk has no ads. Food and weight data is neither sold nor used for ad targeting.
Calk works this way by default: the food catalog, calculations and diary live on your device. Limited product analytics can be turned off in Settings. Read more about data and privacy.
When Calk is not the right tool#
For the values printed on that package, a current barcode linked to a correctly entered label is more exact than a general model of its food category.
Calk cannot measure oil in a restaurant meal. It can expose the assumption, but the assumption remains an estimate.
Even 2,100+ options do not cover the world. We keep expanding the catalog; if your food is missing, email support@calk.me.
A recipe and kitchen scale give more manual control than Calk's familiar portion choices.
If you mainly need exact package-label matching or gram-level recipe control, Calk is the wrong tool.
For everyone else the trade is worth saying out loud: a thirty-second estimate you keep making beats a gram-accurate diary you quit in week three. Calk is built for the first one. If you are tired of choosing among twenty rows, repairing camera output and maintaining versions of home recipes:
Not more ways to log food. One clear template that is easy to repeat and change.
Calk is available on iPhone, iPad, and Android.



Frequently asked#
Why doesn’t Calk have a barcode scanner?
How accurate is calorie counting from a photo?
How is a meal template different from Recent or a saved meal?
Can Calk handle home-cooked or restaurant food without a scale?
Sources and comparison method#
Competitor features and database-size claims were checked against official product and support pages between 12 and 14 July 2026, and rechecked on 5 September 2026. They can vary by country, platform and plan.
We also reviewed Lose It!, FatSecret, Lifesum, YAZIO, MyNetDiary, Carb Manager, Fitia, Fitatu, MacrosFirst, Nutritionix Track, FoodNoms, My Macros+, WeightWatchers, HealthifyMe, Fooducate, Foodvisor, Bitesnap, Calorie Mama, Ate, ParrotPal, Carbon Diet Coach, RP Diet Coach, Garmin Connect+ Nutrition and Zepp. The arena above includes only the claims sourced here.
Sahoo PK, Chiu SYH, Lin YS, Chen CH, Irianti D, Chen HY, Sarkar M, Liu YC. Automatic Image Recognition Meal Reporting Among Young Adults: Randomized Controlled Trial. JMIR mHealth and uHealth. 2025;13:e60070. DOI 10.2196/60070. Two arms of a research app on the same 17-dish menu: automatic image-based reporting (22 participants, 220 dishes) and voice input (20 participants, 200 dishes). Both arms let participants review and correct the report; the outcome measured was whether the dish was reported correctly, not its calories. ↩︎
Shonkoff E, Cara KC, Pei XA, Chung M, Kamath S, Panetta K, Hennessy E. AI-based digital image dietary assessment methods compared to humans and ground truth: a systematic review. Annals of Medicine. 2023;55(2):2273497. PMID 38060823. The review retained 52 papers published from 2010 to 2023; heterogeneity prevented meta-analytic synthesis. ↩︎
SnapCalorie FAQ: the company describes estimating invisible oils, fats and sugar from averages, visual cues and user input. ↩︎
MyFitnessPal: where its food data comes from; Noom: search and barcode scanning. ↩︎
Maringer M, Wisse-Voorwinden N, van ’t Veer P, Geelen A. Food identification by barcode scanning in the Netherlands: a quality assessment of labelled food product databases underlying popular nutrition applications. Public Health Nutrition. 2019;22(7):1215–1222; published online 2 July 2018. DOI 10.1017/S136898001800157X. The sample contained 100 products from two Dutch supermarket chains; the result should not be generalized automatically to other countries or years. ↩︎
Fitzpatrick L, Arcand J, L’Abbe M, Deng M, Duhaney T, Campbell N. Accuracy of Canadian Food Labels for Sodium Content of Food. Nutrients. 2014;6(8):3326–3335. DOI 10.3390/nu6083326. The CFIA samples were collected from 2006 to 2010, and each nutrient-specific rate used only the products tested for that nutrient. ↩︎
MacroFactor: Food Search Database. Figures are company claims, checked 14 July 2026 and again 5 September 2026. ↩︎
Tran T, Manoogian ENC, Hou ZJ, et al. The diversity and consistency of what and when people eat. Nature Metabolism. 2026;8:981–997. DOI 10.1038/s42255-026-01504-0. Exploratory cross-sectional analysis of 21,006 adults who recorded 10–14 days of food and beverage logs in the myCircadianClock research app. ↩︎