
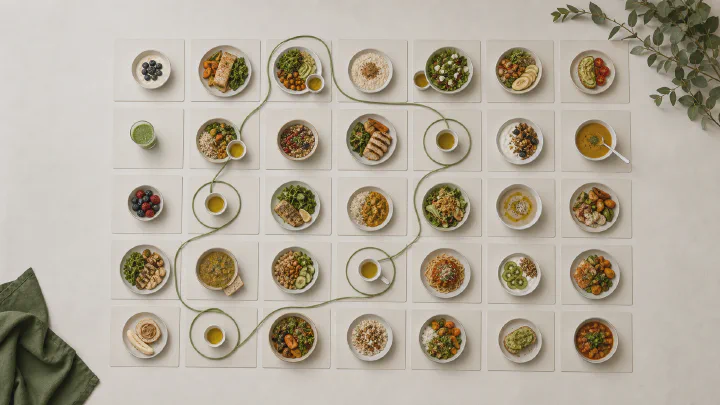
What shapes your month most: your usual lunch, extras in your coffee or a couple of dinners out? Daily totals cannot tell you. You need to compare the entries and find what repeats.
Calk does that review for you: it brings scattered entries together into a picture of the month and shows which meals to start with. Dozens of daily totals become clear findings about your diet.
Log your usual meals#
Everyday breakfasts, work lunches, weekends and dinners out all belong in the picture. Log your food and weight, and Calk will show when there is enough data for a monthly Nutrition Report. See the Nutrition Report page for how to get your first review.
Sources matter more than the total#
Two months with the same average calorie intake can have very different structures. In one, energy is distributed across regular meals. In the other, more of the same total comes from sauces and cooking oil, or is concentrated in two weekends of higher-calorie meals.
The report shows the contribution of specific foods, meals and cooking methods alongside daily totals. That makes it easier to choose a change that will make a difference to your usual diet. Related guides cover oil and hidden calories and changing the cooking method.
Repeated days matter more than exceptions#
One higher-calorie day does not establish a pattern. It is more useful to identify the breakfasts, lunches and dinners that repeat, then compare them with days outside the usual range.
The report compares a typical day, the most balanced recorded day and days with notable differences. This helps separate a recurring habit from a rare event. It also names recurring sources of protein and fiber and shows how many recorded days met the protein target. The guide to daily protein adequacy shows one example of this analysis.
Nutrients need their sources#
The report shows how much of each vitamin and mineral comes from the food you logged, and which foods supply it.
If your diet is short on something, it is easier to find foods that fill the gap. Explore dietary variety in the Variety Map.
Nutrient density and estimated satiety#
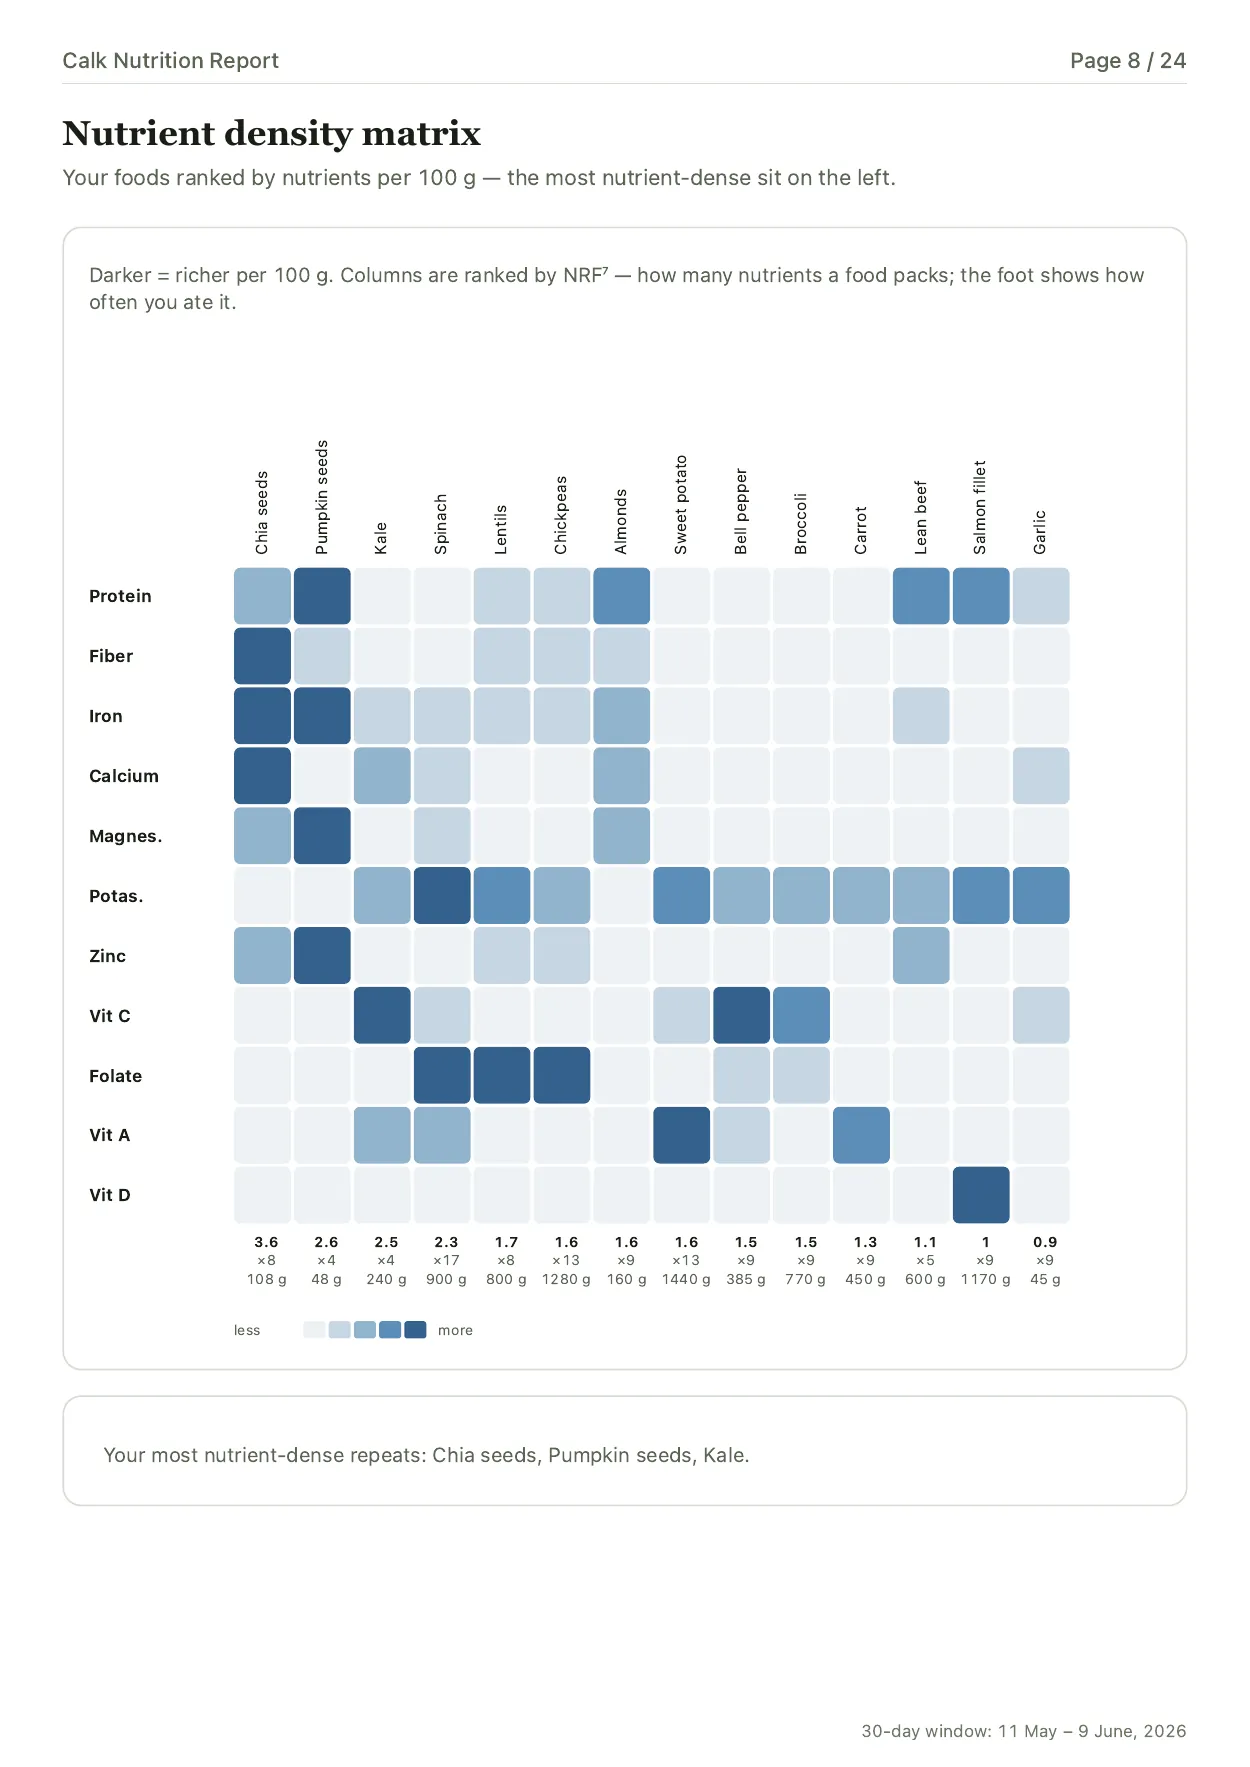
Two foods with the same calories can differ substantially in protein, fiber, water, vitamins and minerals. The nutrient-density matrix compares foods from your diary by their nutrient content per 100 g.
Estimated satiety helps you compare meals and find options that may be more filling for the same calories. Foods with lower calorie density and more protein tend to score higher, yet the two measures stay separate: the better direction is lower calorie density and higher estimated satiety Rolls 2017 Leidy 2015.
The next step should follow from the records#
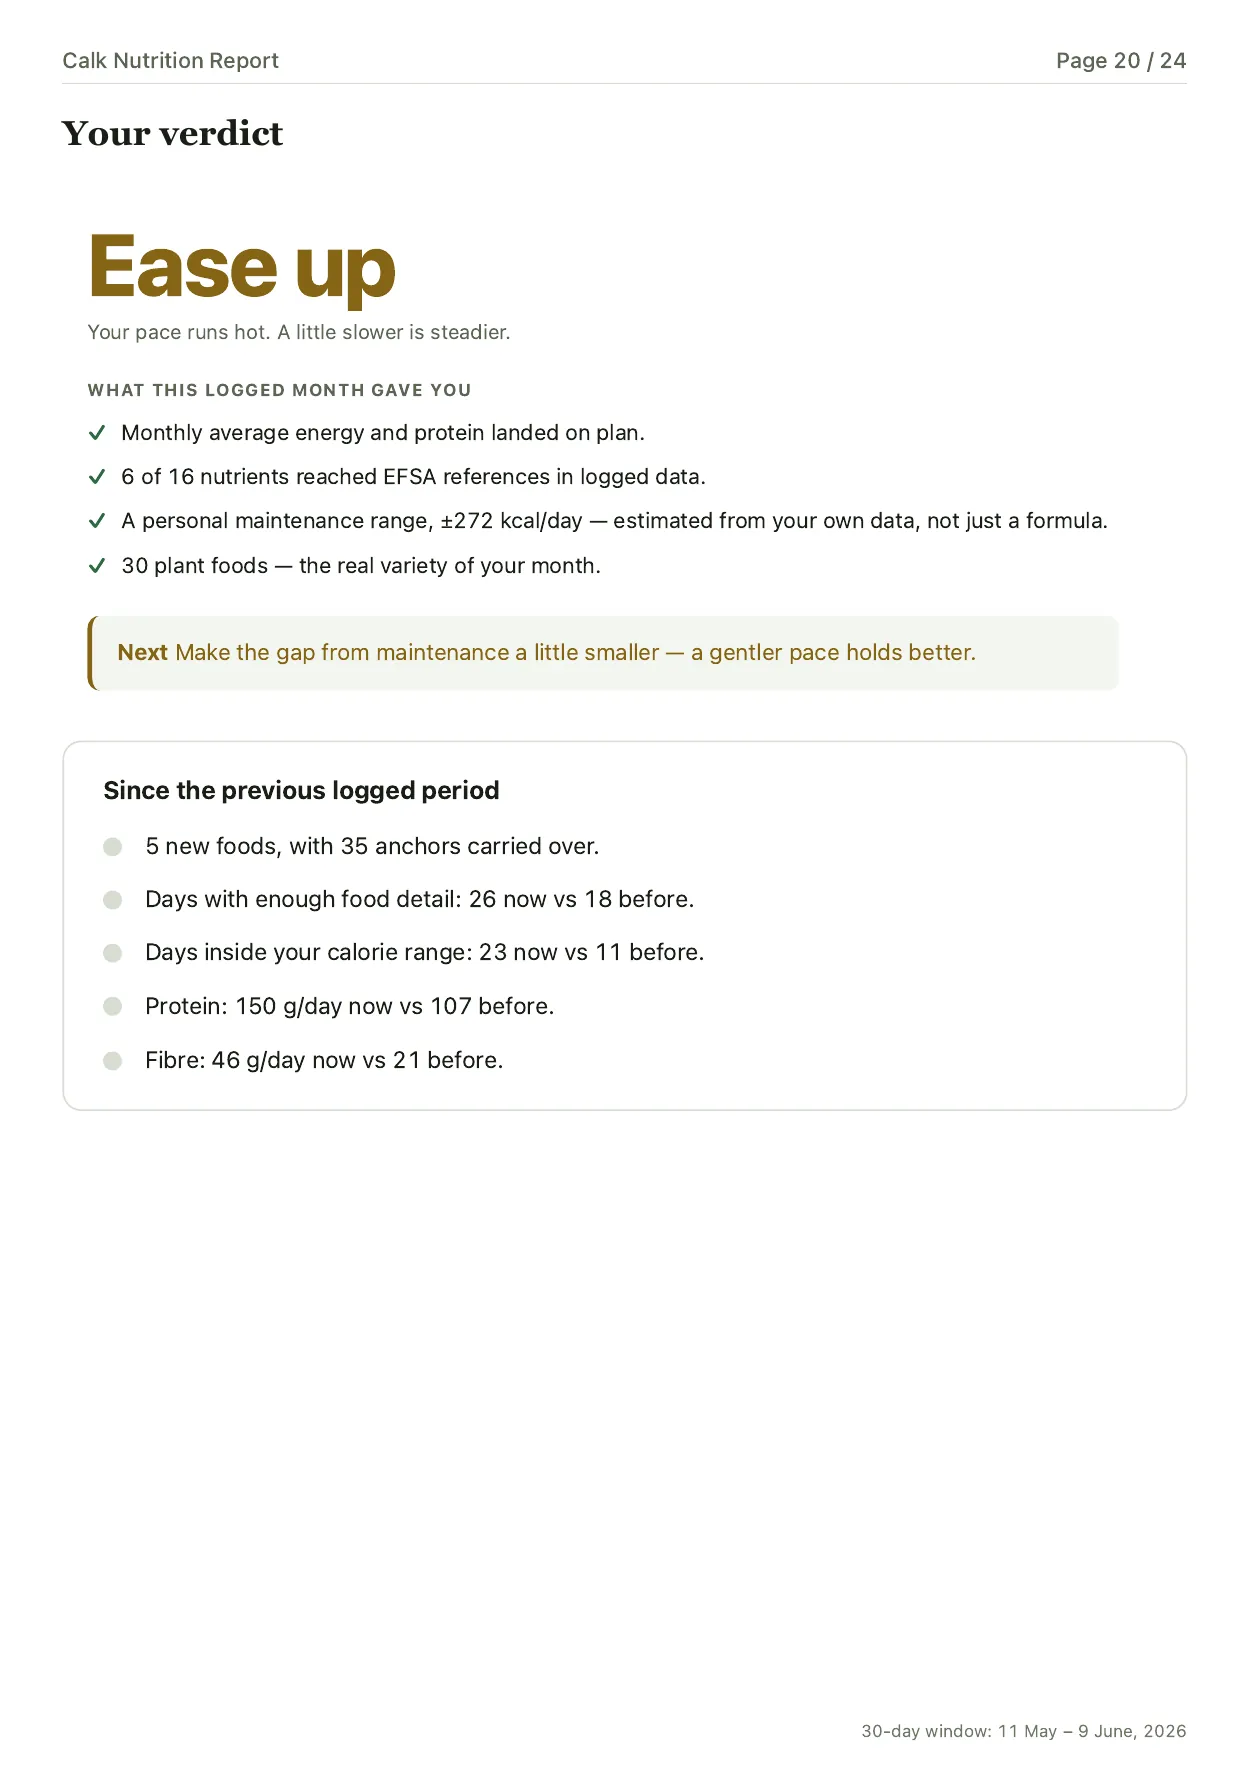
At the end, the report highlights one recurring feature that made a noticeable difference to the month. It may be portion size, a regular calorie source, protein distribution or the rate of weight change.
If a finding concerns a familiar meal, you can add something, replace something or keep what already works. Lower calorie density has been studied directly in weight-loss research Rolls 2006. For example, replace some of a rich dressing or side dish with vegetables while keeping the meal familiar. Read why diets don’t work for more on how food composition can make changes easier to stick with.
Make the changes and follow your weight. Once the changes from the report are habits and the trend is on track, you can stop logging food every day and keep weighing yourself. Return to the diary if your weight persistently moves away from your goal or your routine changes.
What a dietitian adds#
With a Calk report, you can start a consultation by discussing specific meals and habits. A dietitian takes your health into account and helps you choose suitable changes, whether you need to adapt your diet to a medical condition or discuss symptoms. The report gives them a detailed picture of your eating habits to work with.
See pages from a sample report or read how to read the report’s figures.
Frequently asked questions#
What does Calk analyze in a food diary?
Does Calk replace a dietitian?
How much data does the first report need?
Can I see why Calk made a suggestion?
Calk is available on iPhone, iPad, and Android.