  1. Articles/

How accurate is Calk without weighing food?

Calk tested 1,803 recipe variants against published recipe and nutrition references.

81% of tested dish variants differ by no more than 10% from a curated recipe or nutrition reference, and 99.7% by no more than 20% — without daily weighing.

Across that test set:

  • the median calorie error is about 4%;
  • 81% of variants are within 10% of the reference;
  • 92% are within 15%;
  • 99.7% are within 20%;
  • the median error for protein, fat and carbohydrates is typically 8–10%.

These numbers describe Calk’s recipe model. They do not measure the food on a user’s plate.

What the test measures
#

Each test compares one version Calk can produce with a published reference for a comparable dish: for example, a particular protein, sauce, cooking method and set of additions.

The comparison asks whether Calk’s calories and macros remain close to the reference when the meal choices are matched.

This catches problems such as:

  • too much or too little oil in the modeled preparation;
  • a sauce or topping with the wrong contribution;
  • an implausible balance of protein, fat and carbohydrates;
  • a meal variant that no longer resembles the reference dish.

The current test results and their date live in one published accuracy record, so the same figures appear wherever Calk makes the claim.

What the test does not measure
#

The test does not know:

  • the exact recipe used in a home or restaurant kitchen;
  • how closely the selected template matches the meal;
  • the exact amount on the plate;
  • how much of the serving was eaten;
  • the exact formula of every branded product.

Those are separate sources of error. The published percentages should not be read as a guarantee for every logged meal.

Why meal choices matter more than a precise-looking result
#

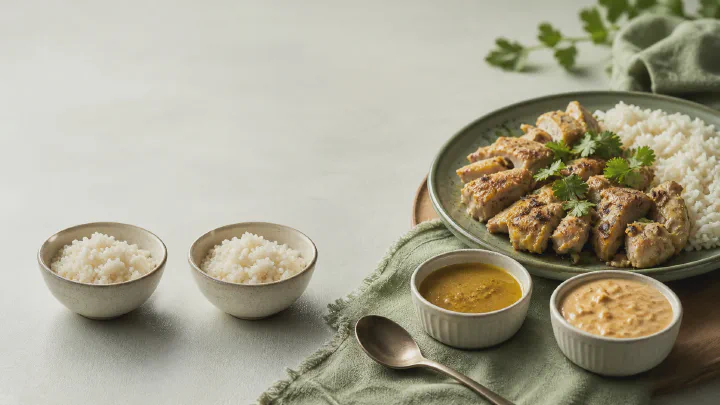
“Chicken curry” can describe a tomato-based curry, a coconut curry or a dish finished with cream and ghee. A database entry can show a precise calorie number without telling you which one it represents.

Calk keeps the important choices inside the meal template: protein, cooking method, sauce, oil, additions and portion. If one of them changes, the whole meal recalculates.

That does not remove estimation. It makes the assumption available to check. A user can change “grilled” to “fried” or “light sauce” to “creamy sauce” instead of accepting a number whose recipe is unknown.

The portion is still your estimate
#

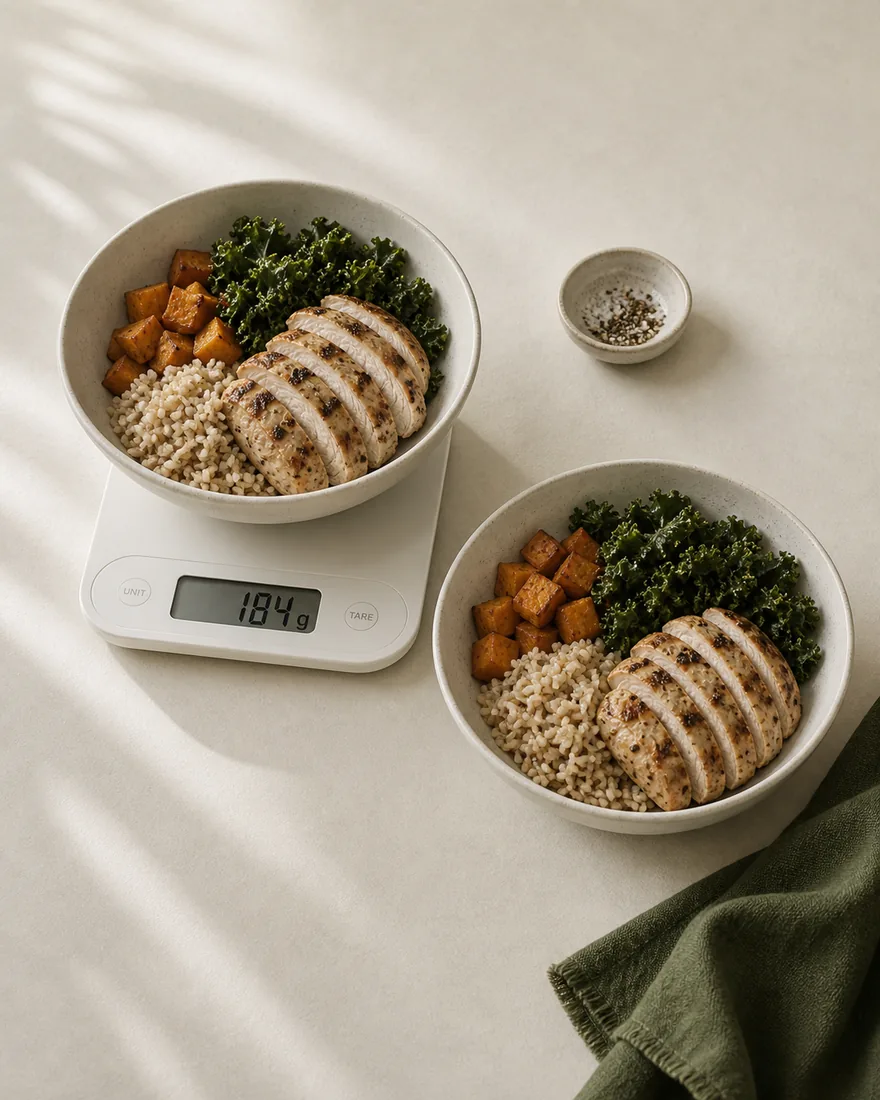
A familiar portion beside a kitchen scale, used to learn what that amount looks like

Calk does not require a kitchen scale. You choose a practical portion that matches what you ate.

Portion estimates are a substantial source of error. In one small visual-estimation study, the mean absolute calorie error was 53.4%, and 40% of estimates missed the true value by at least 50% Lansky 1982.

A scale can be useful once as a visual reference: weigh a familiar bowl or serving, notice what it looks like, then return to the normal no-scale flow. Calk itself remains an estimate rather than a gram-entry system.

For the full portion method, see calorie counting without weighing food.

Packaged food is a separate test layer
#

Calk models generic food types, not every brand and formulation. The current check across 243 packaged products measures three different things, and they are worth keeping apart.

Composition per 100 g — how closely Calk’s profile matches the label:

  • calories — 3.5% median deviation;
  • carbohydrate — 6.4%, fat — 8.6%, protein — 11.8%;
  • fiber — 14.4%, salt — 16.0%.

Portion weight — whether a serving button lands on the size actually eaten: 4% across the 232 products people log as a unit or a serving.

The eaten portion as a whole — where both of the errors above act at the same time: 6.9% on calories. That is a separate measurement, not the sum of the two figures above.

Fiber and salt are the weakest parts of the model, and the numbers say so. The reason is that a generic food is being compared against a specific brand.

Those results describe the tested products. When the exact current package is in front of you, use its label for that product’s declared values. Calk uses labels to validate packaged-food models, but it does not replace a brand-specific label database.

Before mapping products to Calk, we also check which fields the source labels contain at all. In a cleaned corpus of 565 real branded products, calories, protein, fat and carbohydrate appeared on 95% of labels; fiber appeared on 72%. This measures field presence, not product accuracy: a missing field is not counted as zero. The corpus is weighted toward popular European products, and the shares are rounded to whole percentages.

How to use the number
#

Use Calk’s estimate to compare choices you can act on:

  • which cooking method changes the meal;
  • whether sauce or oil is the main calorie source;
  • what happens when the protein or base changes;
  • whether the portion has moved from your usual one;
  • which repeated meals drive the monthly pattern.

Do not use it as a laboratory measurement, a medical result or proof of the exact calories served by a restaurant.

For the data sources, consolidation rules and meal-level checks behind these figures, read where Calk’s food numbers come from.

Calk is available on iPhone, iPad, and Android.

Frequently asked
#

How accurate is Calk?

Across 1,803 recipe variants tested against published recipe and nutrition references, the median calorie error is about 4%. 81% are within 10% of the reference, 92% within 15% and 99.7% within 20%.

Does 99.7% mean every logged meal is within 20%?

No. It means 99.7% of the tested recipe variants were within 20% of their reference. A real log also depends on choosing the closest meal options and estimating the portion.

Do I need a kitchen scale?

No. Calk is designed for practical portion estimates. A scale can help you learn what a familiar portion looks like, but Calk does not require weighed entry for normal use.

Is Calk accurate for branded packaged food?

Calk models generic food types rather than every branded product. Across 243 packaged products the median deviation in composition per 100 g is 3.5% for calories and 6.4–11.8% for the core macros; for the eaten portion, where portion-weight error is added, it is 6.9% on calories. Use the current label when you need the values for one exact product.

Where can I see how the food data is built?

Where Calk’s food numbers come from explains the official databases, specialist publications, label checks and recipe-level validation behind the catalog.